10-K: Annual report pursuant to Section 13 and 15(d)
Published on May 25, 2007
UNITED
STATES
SECURITIES
AND EXCHANGE COMMISSION
Washington,
D.C. 20549
FORM
10-K
(Mark
One)
x Annual
report pursuant to section 13 or 15(d) of the securities exchange act of
1934
For
the fiscal year ended March 31,
2007
o Transition
report pursuant to Section 13 or 15(d) of the Securities Exchange Act of
1934
For
the transition period from
__________ to __________
Commission
File Number: 0-21184

MICROCHIP
TECHNOLOGY INCORPORATED
(Exact
Name of Registrant as Specified in Its Charter)
|
Delaware
|
86-0629024
|
|
|
(State
or Other Jurisdiction of
Incorporation
or Organization)
|
(IRS
Employer
Identification
No.)
|
2355
W. Chandler Blvd., Chandler, AZ 85224
(Address
of Principal Executive Offices, Including Zip Code)
(480)
792-7200
(Registrant’s
Telephone Number, Including Area Code)
Securities
registered pursuant to Section 12(b) of the Act:
Title
of Each Class
Common
Stock, $0.001 Par Value Per Share
Preferred
Share Purchase Rights
Securities
registered pursuant to Section 12(g) of the Act:
None
Indicate
by check mark if the registrant is a well-known seasoned issuer, as defined
in
Rule 405 of the Securities Act.ýYes¨No
Indicate
by check mark if the registrant is not required to file reports pursuant to
Section 13 or Section 15(d) of the Act.¨YesýNo
Indicate
by checkmark whether the
Registrant: (1) has filed all reports required to be filed by Section 13 or
15(d) of the Securities Exchange Act of 1934 during the preceding 12 months
(or
for such shorter period that the registrant was required to file such reports),
and (2) has been subject to such filing requirements for the past 90
days:ýYes¨No
Indicate
by check mark if disclosure of delinquent filers pursuant to Item 405 of
Regulation S-K (§229.405 of this chapter) is not contained herein, and will not
be contained, to the best of registrant’s knowledge, in definitive proxy or
information statements incorporated by reference in Part III of Form 10-K or
any
amendment to this Form 10-K¨
Indicate
by check mark whether the registrant is large accelerated filer, an accelerated
filed, or a non-accelerated filer. See definition of “accelerated
filer and large accelerated filer” in Rule 12b-2 of the Exchange
Act. (Check one):
Large
accelerated
filer ý Accelerated
filer ¨ Non-accelerated
filer ¨
Indicate
by check mark whether the registrant is a shell company (as defined in Rule
12b-2 of the Act).¨YesýNo
Aggregate
market value of the voting and non-voting common equity held by non-affiliates
as of September 30, 2006 based upon the closing price of the common stock as
reported by The NASDAQ® National
Market on
such date was approximately
$6,853,133,147.
Number
of
shares of Common Stock, $.001 par value, outstanding as of May 21,
2007: 218,352,543
Documents
Incorporated by Reference
Document Part
of Form 10-K
Proxy
Statement for the 2007 Annual Meeting of
Stockholders III
MICROCHIP
TECHNOLOGY INCORPORATED AND SUBSIDIARIES
FORM
10-K
TABLE
OF CONTENTS
|
Page
|
||
|
PART
I
|
||
|
PART
II
|
||
|
|
||
|
PART
III
|
||
|
PART
IV
|
||
| Signatures | ||
2
PART
I
This
Form 10-K contains certain forward-looking statements that involve risks and
uncertainties, including statements regarding our strategy and future financial
performance and those statements identified under "Item 7 - Note Regarding
Forward-looking Statements.” Our actual results could differ
materially from the results described in these forward-looking statements as
a
result of certain factors including those set forth under “Item 1A – Risk
Factors,” beginning below at page 10, and elsewhere in this Form
10-K. Although we believe that the matters reflected in the
forward-looking statements are reasonable, we cannot guarantee future results,
levels of activity, performance or achievements. You should not place
undue reliance on these forward-looking statements. We disclaim any
obligation to update information contained in any forward-looking
statement.
Item
1. BUSINESS
We
develop and manufacture specialized semiconductor products used by our customers
for a wide variety of embedded control applications. Our product
portfolio comprises 8- and 16-bit PIC® microcontrollers
and 16-bit dsPIC® digital
signal
controllers, which feature on-board Flash (reprogrammable) memory
technology. In addition, we offer a broad spectrum of
high-performance linear, mixed-signal, power management, thermal management,
battery management and interface devices. We also make serial
EEPROMs. Our synergistic product portfolio targets thousands of
applications and a growing demand for high-performance designs in the
automotive, communications, computing, consumer and industrial control
markets. Our quality systems are ISO/TS16949 (2002 version)
certified.
Microchip
Technology Incorporated was incorporated in Delaware in 1989. In this
Form 10-K, “we,” “us,” and “our” each refers to Microchip Technology
Incorporated and its subsidiaries. Our executive offices are located
at 2355 West Chandler Boulevard, Chandler, Arizona 85224-6199 and our telephone
number is (480) 792-7200.
Our
Internet address is www.microchip.com. We post the following
filings on our website as soon as reasonably practicable after they are
electronically filed with or furnished to the Securities and Exchange
Commission:
|
|
·
|
our
annual report on Form 10-K
|
|
|
·
|
our
quarterly reports on Form 10-Q
|
|
|
·
|
our
current reports on Form 8-K
|
|
|
·
|
our
proxy statement
|
|
|
·
|
any
amendments to the above-listed reports filed or furnished pursuant
to
Sections 13(a) or 15(d) of the Securities Exchange Act of
1934
|
All
SEC
filings on our website are available free of charge. The information
on our website is not incorporated into this Form
10-K.
Industry Background
Competitive
pressures require manufacturers of a wide variety of products to expand product
functionality and provide differentiation while maintaining or reducing
cost. To address these requirements, manufacturers often use
integrated circuit-based embedded control systems that enable them
to:
|
|
·
|
differentiate
their products
|
|
|
·
|
replace
less efficient electromechanical control
devices
|
|
|
·
|
reduce
the number of components in their
system
|
|
|
·
|
add
product functionality
|
|
|
·
|
decrease
time to market for their products
|
|
|
·
|
significantly
reduce product cost
|
Embedded
control systems have been incorporated into thousands of products and
subassemblies in a wide variety of applications and markets worldwide,
including:
| · | automotive comfort, safety and entertainment applications |
|
|
·
|
remote
control devices
|
|
|
·
|
handheld
tools
|
|
|
·
|
home
appliances
|
|
|
·
|
portable
computers
|
|
|
·
|
robotics
|
|
|
·
|
accessories
|
|
|
·
|
cordless
and cellular telephone
|
|
|
·
|
motor
controls
|
|
|
·
|
security
systems
|
|
|
·
|
educational
and entertainment devices
|
|
|
·
|
consumer
electronics
|
|
|
·
|
power
supplies
|
3
Embedded
control systems
typically incorporate a microcontroller as the principal active, and sometimes
sole, component. A microcontroller is a self-contained
computer-on-a-chip consisting of a central processing unit, non-volatile program
memory, random access memory for data storage and various input/output
peripheral capabilities. In addition to the microcontroller, a
complete embedded control system incorporates application-specific software
and
may include specialized peripheral device controllers, non-volatile memory
components such as EEPROMs, and various analog and interface
products.
The
increasing demand for embedded control has made the market for microcontrollers
one of the larger segments of the semiconductor
market. Microcontrollers are currently available in 4-bit through
32-bit architectures. 4-bit microcontrollers are relatively
inexpensive, but they generally lack the minimum functionality required in
most
applications and are typically used in relatively simple
applications. 8-bit microcontrollers remain very cost-effective for a
wide range of high volume embedded control applications and, as a result,
continue to represent the largest portion of the overall microcontroller
market. 16-bit and 32-bit microcontrollers provide higher performance
and functionality, and are generally found in more complex embedded control
applications.
Many
of
the microcontrollers shipped today are ROM-based and must be programmed by
the semiconductor supplier during manufacturing, resulting in long lead times,
based on market conditions, for delivery of such microcontrollers. In
addition to delayed product introduction, these long lead times can result
in
potential inventory obsolescence and temporary factory shutdowns when changes
in
the firmware are required. To address these issues, some suppliers offer
programmable microcontrollers that can be configured by the customer in the
customer’s manufacturing line, thus significantly reducing lead time and
inventory risks when the inevitable firmware changes occur. While
these microcontrollers were initially expensive relative to ROM-based
microcontrollers, manufacturing technology has evolved over time to the point
where reprogrammable microcontrollers are now available for little to no premium
over ROM-based microcontrollers, thus providing significant value to
microcontroller customers. As a result, reprogrammable
microcontrollers are the fastest growing segment of the microcontroller
market.
Our
Products
Our
strategic focus is on embedded control solutions, including:
|
|
·
|
microcontrollers
|
|
|
·
|
development
tools
|
|
|
·
|
analog
and interface products
|
|
|
·
|
memory
products
|
We
provide highly cost-effective embedded control solutions that also offer the
advantages of small size, high performance, low voltage/power operation and
ease
of development, enabling timely and cost-effective embedded control product
integration by our customers.
Microcontrollers
We
offer
a broad family of microcontroller products featuring our unique, proprietary
architecture marketed under the PIC® brand
name. We believe that our PIC product family is a price/performance
leader in the worldwide microcontroller market. We have shipped over
5 billion PIC microcontrollers to customers worldwide since their introduction
in 1990. Our PIC products are designed for applications requiring
field-programmability, high performance, low power and cost
effectiveness. They feature a variety of memory technology
configurations, low voltage and power, small footprint and ease of
use. Our performance results from a product architecture which
features dual data and instruction pathways, referred to as a Harvard dual-bus
architecture; a Reduced Instruction Set Computer, referred to as RISC; and
variable length instructions; all of which provide significant speed advantages
over alternative single-bus, Complex Instruction Set Computer architectures,
referred to as CISC. With over 400 microcontrollers in our product
portfolio, we target the 8-bit and 16-bit microcontroller
markets. Additionally, our scalable product architecture allows us to
successfully target both the entry-level of the 32-bit microcontroller market,
as well as the 4-bit microcontroller marketplace, significantly enlarging our
addressable market.
Digital
Signal Controllers (DSC) are a subset of our 16-bit microcontroller
offering. Our dsPIC® Digital
Signal Controller families integrate the control features of high-performance
16-bit microcontrollers with the computation capabilities of Digital Signal
Processors (DSPs), along with a wide variety of peripheral functions making
them
suitable for a large number of embedded control applications. Our
dsPIC product family offers a broad suite of hardware and software development
tools, software application libraries, development boards and reference designs
to ease and expedite the customer application development cycle. With
its field-re-programmability, large selection of peripheral functions, small
footprint and ease of use, we believe that our dsPIC Digital Signal Controllers
enlarge our addressable market.
4
We
have
used our manufacturing experience and design and process technology to bring
additional enhancements and manufacturing efficiencies to the development and
production of our PIC family of microcontroller products. Our
extensive experience base has enabled us to develop our advanced, low cost
user
programmability feature by incorporating non-volatile memory, such as Flash,
EEPROM and EPROM Memory, into the microcontroller, and to be a leader in
reprogrammable microcontroller product offerings.
Development
Tools
We
offer
a comprehensive set of low-cost and easy-to-learn application development
tools. These tools enable system designers to quickly and easily
program a PIC microcontroller and dsPIC Digital Signal Controllers for specific
applications and, we believe are a key factor for obtaining design
wins.
Our
family of development tools operates in the standard Windows® environment
on
standard PC hardware. These tools range from entry-level systems,
which include an assembler and programmer or in-circuit debugging hardware,
to
fully configured systems that provide in-circuit emulation
hardware. Customers moving from entry-level designs to those
requiring real-time emulation are able to preserve their investment in learning
and tools as they migrate to future PIC devices since all of our systems share
the same integrated development environment.
Many
independent companies also develop and market application development tools
that
support our standard microcontroller product architecture. Currently,
there are more than 150 third-party tool suppliers worldwide whose products
support our proprietary microcontroller architecture.
We
believe that familiarity with and adoption of both our and third-party
development tools by an increasing number of product designers will be an
important factor in the future selection of our embedded control
products. These development tools allow design engineers to develop
thousands of application-specific products from our standard
microcontrollers. To date, we have shipped more than 500,000
development tools.
Analog
and Interface Products
Our
analog and interface products now consist of several families with over 500
power management, linear, mixed-signal, thermal management and interface
products. At the end of fiscal 2007, our mixed-signal analog and
interface products were being shipped to more than 12,100 end
customers.
We
continue marketing and selling our analog and interface products into our
existing microcontroller customer base, which we refer to as our analog “attach”
strategy, as well as to new customers. In addition to our “attach”
strategy, we market and sell other products that may not fit our traditional
PIC
microcontroller and memory products customer base. We market these,
and all of our products, based on an application segment approach targeted
to
provide customers with application solutions.
Memory
Products
Our
memory products consist primarily of serial electrically erasable programmable
read only memory, referred to as Serial EEPROMs. We sell these
devices primarily into the embedded control market, and we are one of the
largest suppliers of such devices worldwide. Serial EEPROM products
are used for non-volatile program and data storage in systems where such data
must be either modified frequently or retained for long
periods. Serial EEPROMs have a very low I/O pin requirement,
permitting production of very small devices.
Manufacturing
Our
manufacturing operations include wafer fabrication and assembly and
test. The ownership of our manufacturing resources is an important
component of our business strategy, enabling us to maintain a high level of
manufacturing control resulting in us being one of the lowest cost producers
in
the embedded control industry. By owning our wafer fabrication
facilities and much of our assembly and test operations, and by employing
statistical techniques (statistical process control,
5
Our
manufacturing facilities are located in:
|
|
·
|
Tempe,
Arizona (Fab 2)
|
|
|
·
|
Chandler,
Arizona (probe operations)
|
|
|
·
|
Puyallup,
Washington (Fab 3)
(non-operational)
|
|
|
·
|
Gresham,
Oregon (Fab 4)
|
|
|
·
|
Bangkok,
Thailand (assembly, probe and test)
|
Wafer
Fabrication
Fab
2
currently produces 8-inch wafers and supports manufacturing processes from
0.35
to 5.0 microns. During fiscal 2007, Fab 2 operated at approximately
99% of its capacity compared to approximately 98% during fiscal
2006. Operating at higher percentages of capacity has a positive
impact on our operating results due to the relatively high fixed costs inherent
in wafer fabrication manufacturing.
Fab
3 is
currently non-operational and being held-for-future-use. See “Item 6
– Selected Financial Data – Fiscal 2003 – Fab 3 Impairment Charge,” below at
page 20, for a discussion of the status of Fab 3.
We
acquired Fab 4 in August 2002 and began production on October 31,
2003. Fab 4 currently produces 8-inch wafers using predominantly 0.5
micron manufacturing processes and is capable of supporting technologies below
0.18 microns. A significant amount of clean room capacity and
equipment acquired with Fab 4 can be brought on line in the future to support
incremental wafer fabrication capacity needs. We believe the combined
capacity of Fab 2, Fab 4 and Fab 3 will provide sufficient capacity to
allow us to respond to increases in future demand.
We
continue to transition products to more advanced process technologies to reduce
future manufacturing costs. We believe that our ability to
successfully transition to more advanced process technologies is important
for
us to remain competitive.
We
outsource a small percentage of our wafer production requirements to third-party
wafer foundries to augment our internal manufacturing capabilities.
Assembly
and Test
We
perform product assembly and testing at our facilities located near Bangkok,
Thailand. At March 31, 2007, approximately 72% of our assembly
requirements were being performed in our Thailand facility. As of
March 31, 2007, our Thailand facility was testing substantially all of our
wafer
production. We use third-party assembly and test contractors in
several Asian countries for the balance of our assembly and test
requirements.
General
Matters Impacting Our Manufacturing Operations
We
employ
proprietary design and manufacturing processes in developing our microcontroller
and memory products. We believe our processes afford us both
cost-effective designs in existing and derivative products and greater
functionality in new product designs. While many of our competitors
develop and optimize separate processes for their logic and memory product
lines, we use a common process technology for both microcontroller and
non-volatile memory products. This allows us to more fully absorb our
process research and development costs and to deliver new products to market
more rapidly. Our engineers utilize advanced Computer Aided Design
tools and software to perform circuit design, simulation and layout, and our
in-house photomask and wafer fabrication facilities enable us to rapidly verify
design techniques by processing test wafers quickly and
efficiently.
Due
to
the high fixed costs inherent in semiconductor manufacturing, consistently high
manufacturing yields have significant positive effects on our gross profit
and
overall operating results. Our continuous focus on manufacturing
productivity has allowed us to maintain excellent manufacturing yields at our
facilities. Our manufacturing yields are primarily
driven by a comprehensive implementation of statistical process control,
extensive employee training and our effective use of our manufacturing
facilities and equipment. Maintenance of manufacturing productivity
and yields are important factors in the achievement of our operating
results. The manufacture of integrated circuits, particularly
non-volatile, erasable CMOS memory and logic devices, such as those that we
produce, are complex processes. These processes are sensitive to a
wide variety of factors, including the level of contaminants in the
manufacturing environment, impurities in
6
the
materials used and the performance of our manufacturing personnel and
equipment. As is typical in the semiconductor industry, we have from
time to time experienced lower than anticipated manufacturing
yields. Our operating results will suffer if we are unable to
maintain yields at approximately the current levels.
At
the
end of fiscal 2007, we owned long-lived assets (consisting of property, plant
and equipment, intangibles and goodwill) in the United States amounting to
$525.0 million and $121.1 million in other countries, including $114.6
million in Thailand. At the end of fiscal 2006, we owned long-lived
assets in the United States amounting to $576.9 million and
$124.5 million in other countries, including $118.0 million in
Thailand.
Research
and Development (R&D)
We
are
committed to continuing our investment in new and enhanced products, including
development systems, and in our design and manufacturing process
technologies. We believe these investments are significant factors in
maintaining our competitive position. Our current R&D activities
focus on the design of new microcontrollers, digital signal controllers, Serial
EEPROM memory, analog and interface products, new development systems, software
and application-specific software
libraries. We are also developing new design and process technologies
to enable new products and innovative features as well as achieve further cost
reductions and performance improvements in existing products.
In
fiscal
2007, our R&D expenses were $113.7 million, compared
to $94.9 million in fiscal 2006 and $93.0 million in
fiscal 2005. R&D expenses in fiscal 2007 included $9.6 million of
share-based compensation as a result of the adoption of FASB Statement of
Financial Accounting Standard (“SFAS”) No. 123R (revised 2004) Share-Based
Payment (“SFAS NO. 123R”).
Sales
and Distribution
General
We
market
our products worldwide primarily through a network of direct sales personnel
and
distributors.
Our
direct sales force focuses on a wide variety of strategic accounts in three
geographical markets: the Americas, Europe and Asia. We currently
maintain sales and technical support centers in major metropolitan areas in
all
three geographic markets. We believe that a strong technical service
presence is essential to the continued development of the embedded control
market. Many of our field sales engineers (FSEs), field application
engineers (FAEs), and sales management have technical degrees or backgrounds
and
have been previously employed in high technology environments. We
believe that the technical knowledge of our sales force is a key competitive
advantage in the sale of our products. The primary mission of our FAE
team is to provide technical assistance to customers and to conduct periodic
training sessions for the balance of our sales team. FAEs also
frequently conduct technical seminars and workshops in major cities around
the
world.
Distribution
Our
distributors focus primarily on servicing the product requirements of a broad
base of diverse customers. We believe that distributors can provide
an effective means of reaching this broad and diverse customer
base. We believe that customers recognize Microchip for its products
and brand name and use distributors as an effective supply channel.
In
fiscal
2007, 2006 and 2005, we derived 65% of our net sales from sales through
distributors and 35% of our net sales from customers serviced directly by
Microchip. Our largest distributor accounted for approximately 11% of
our net sales in fiscal 2007 and 13% of our net sales in fiscal 2006 and
2005. Our second largest distributor accounted for approximately 10%
of our net sales in fiscal 2007, 11% of our net sales in
fiscal 2006 and 12% of our net sales in fiscal 2005. No other
distributor or end customer accounted for more than 10% of our net sales in
fiscal 2007, 2006 or 2005.
Distributors
generally have broad-based rights to return product to us. As revenue
on distributor shipments is not recognized until the distributors sell our
product to their end customers, distributor returns have no impact on our
revenue.
We
also
grant certain credits to our distributors. The credits are granted to
the distributors on specifically identified pieces of the distributors’ business
to allow them to earn a competitive gross margin on the sale of our products
to
their end customers. The
credits are on a per unit basis and are not given to the distributor until
they
provide information regarding the sale to their end customer. The
effect of granting these credits establishes the net selling price from us
to
our distributors for the products and results in the net revenue recognized
by
us when the product is sold by the distributors to their end
customers.
7
We
also
provide these distributors with price protection by reducing product pricing
based on market conditions, competitive considerations and other
factors. Price protection is granted to distributors on the inventory
that they have on hand at the date the price protection is
offered. When we reduce the selling price of our products, it allows
the distributors to claim a credit against their outstanding accounts receivable
balances based on the new price of the inventory they have on hand as of the
date of the price reduction. There is no revenue recognition impact
from the price protection activity.
We
do not
offer material incentive programs to our distributors.
We
do not
have long-term agreements with our distributors and we, or our distributors,
may
each terminate our relationship with little or no advanced
notice. The loss of, or the disruption in the operations of, one or
more of our distributors could reduce our future net sales in a given quarter
and could result in an increase in inventory returns.
Sales
by Geography
Sales
by
geography for fiscal 2007, 2006 and 2005 were as follows (dollars in
thousands):
|
Year
Ended March 31,
|
||||||||||||||||||||||||
|
2007
|
|
2006
|
|
2005
|
|
|||||||||||||||||||
|
Americas
|
$ |
287,371
|
27.6
|
%
|
$ |
266,353
|
28.7
|
% | $ |
248,881
|
29.4
|
% | ||||||||||||
|
Europe
|
302,708
|
29.1
|
255,367
|
27.5
|
232,493
|
27.4
|
||||||||||||||||||
|
Asia
|
449,592
|
43.3
|
406,173
|
43.8
|
365,562
|
43.2
|
||||||||||||||||||
|
Total
Sales
|
$ |
1,039,671
|
100.0 | % | $ |
927,893
|
100.0 | % | $ |
846,936
|
100.0 | % | ||||||||||||
Sales
to
foreign customers accounted for approximately 74% of our net sales in fiscal
2007, 74% of our net sales in fiscal 2006 and 73% of our net sales in fiscal
2005. Our sales to foreign customers have been predominately in Asia
and Europe, which we attribute to the manufacturing strength in those areas
for
automotive, communications, computing, consumer and industrial control
products. Americas sales include sales to customers in the United
States, Canada, Central America and South America.
Sales
to
customers in China, including Hong Kong, accounted for approximately 18% of
our
net sales in fiscal 2007 and 17% of our net sales in fiscal 2006 and
2005. In fiscal 2007, 2006 and 2005, sales to customers in Taiwan
accounted for approximately 10% of our net sales. We did not have
sales into any other foreign countries that exceeded 10% of our net sales during
fiscal 2007, 2006 or 2005.
Our
international sales are predominately U.S. dollar
denominated. Although foreign sales are subject to certain government
export restrictions, we have not experienced any material difficulties to date
as a result of export restrictions.
The
semiconductor industry is characterized by seasonality and wide fluctuations
of
supply and demand. Since a significant portion of our revenue is from
consumer markets and international sales, our business may be subject to
seasonally lower revenues in the third and fourth quarters of our fiscal
year. However, broad strength in our overall business in recent
periods has had a more significant impact on our results than seasonality,
and
has made it difficult to assess the impact of seasonal factors on our
business.
Backlog
As
of
April 30, 2007 our backlog was approximately $185.4 million, compared to $231.2
million as of April 30, 2006. Our backlog includes all purchase
orders scheduled for delivery within the subsequent 12 months.
We
primarily produce standard products that can be shipped from inventory within
a
short time after we receive an order. Our business and, to a large
extent, that of the entire semiconductor industry, is characterized by
short-term orders and shipment schedules. Orders constituting our
current backlog are subject to changes in delivery schedules, or to cancellation
at the customer’s option without significant penalty. Thus, while
backlog is useful for scheduling production, backlog as of any particular date
may not be a reliable measure of sales for any future period.
Competition
The
semiconductor industry is intensely competitive and has been characterized
by
price erosion and rapid technological change. We compete with major
domestic and international semiconductor companies, many of which have greater
market recognition and greater financial, technical, marketing, distribution
and
other resources than we have with which to pursue
8
We
currently compete principally on the basis of the technical innovation and
performance of our embedded control products, including the following product
characteristics:
|
|
·
|
speed
|
|
|
·
|
functionality
|
|
|
·
|
density
|
|
|
·
|
power
consumption
|
|
|
·
|
reliability
|
|
|
·
|
packaging
alternatives
|
We
believe that other
important competitive factors in the embedded control market
include:
|
|
·
|
ease
of use
|
|
|
·
|
functionality
of application development systems
|
|
|
·
|
dependable
delivery and quality
|
|
|
·
|
technical
service and support
|
|
|
·
|
price
|
|
|
·
|
availability
|
We
believe that we compete favorably with other companies on all of these factors,
but we may be unable to compete successfully in the future, which could harm
our
business.
Patents,
Licenses and Trademarks
We
maintain a portfolio of United States and foreign patents, expiring on various
dates between 2007 and 2024. We also have numerous additional United
States and foreign patent applications pending. We do not expect that
the expiration of any particular patent will have a material impact on our
business. While we intend to continue to seek patents on our
inventions and manufacturing processes, we believe that our continued success
depends primarily on the technological skills and innovative capabilities of
our
personnel and our ability to rapidly commercialize product developments, rather
than on our patents. Our existing patents and any new patents that
are issued may not be of sufficient scope or strength to provide meaningful
protection or any commercial advantage to us. In addition, the laws
of certain foreign countries do not protect our intellectual property rights
to
the same extent as the laws of the United States.
We
have
entered into certain intellectual property licenses and cross-licenses with
other companies related to semiconductor products and manufacturing
processes. As is typical in the semiconductor industry, we and our
customers have from time to time received, and may in the future receive,
communications from third parties asserting patent or other intellectual
property rights on certain of our products or technologies. We
investigate all such notices and respond as we believe is
appropriate. Based on industry practice, we believe that in most
cases we can obtain any necessary licenses or other rights on commercially
reasonable terms, but we cannot assure that all licenses would be on acceptable
terms, that litigation would not ensue or that damages for any past infringement
would not be assessed. Litigation, which could result in substantial
cost to us and require significant attention from management, may be necessary
to enforce our patents or other intellectual property rights, or to defend
us
against claimed infringement of the rights of others. The failure to
obtain necessary licenses or other rights, or litigation arising out of
infringement claims, could harm our business.
Environmental
Regulation
We
must
comply with many different federal, state, local and foreign governmental
regulations related to the use, storage, discharge and disposal of certain
chemicals and gases used in our manufacturing processes. Our
facilities have been designed to comply with these regulations and we believe
that our activities are conducted in compliance with such
regulations. Any changes in such regulations or in their enforcement
could require us to acquire costly equipment or to incur other significant
expenses to comply with environmental regulations. Any failure by us
to adequately control the storage, use and disposal of regulated substances
could result in future liabilities.
Increasing
public attention has been focused on the environmental impact of electronic
manufacturing operations. While we have not experienced any
materially adverse effects on our operations from environmental regulations,
our
business and results
of operations could suffer if for any reason we fail to control the use of,
or
to adequately restrict the discharge of, hazardous substances under present
or
future environmental regulations.
9
Employees
As
of
March 31, 2007, we had 4,582 employees. None of our employees are
represented by a labor organization. We have never had a work
stoppage and believe that our employee relations are good.
Executive
Officers
The
following sets forth certain information regarding our executive officers as
of
April 30, 2007:
|
Name
|
Age
|
Position
|
|
Steve
Sanghi
|
51
|
Chairman
of the Board, President and Chief Executive Officer
|
|
Ganesh
Moorthy
|
47
|
Executive
Vice President
|
|
Stephen
V. Drehobl
|
45
|
Vice
President, Security, Microcontroller and Technology
Division
|
|
David
S. Lambert
|
55
|
Vice
President, Fab Operations
|
|
Mitchell
R. Little
|
54
|
Vice
President, Worldwide Sales and Applications
|
|
Gordon
W. Parnell
|
57
|
Vice
President, Chief Financial Officer
|
|
Richard
J. Simoncic
|
43
|
Vice
President, Analog and Interface Products
Division
|
Mr.
Sanghi has been President since August 1990, CEO since October 1991, and
Chairman of the Board since October 1993. He has served as a director
since August 1990. Mr. Sanghi holds an M.S. degree in Electrical and
Computer Engineering from the University of Massachusetts and a B.S. degree
in
Electronics and Communication from Punjab University, India. Since May,
2004, he has been a
member of the Board of Directors of Xyratex Ltd., a storage and network
technology company. Since May 2007, he has been a member of the Board
of Directors of FIRST (For Inspiration and Recognition of Science and
Technology).
Mr.
Moorthy has served as Executive Vice President since October 2006 and Vice
President, Advanced Microcontroller and Memory Division, since December
2003. From November 2001 to December 2003, he served as Vice
President, Advanced Microcontroller and Automotive Division. Prior to
this time, he served in various executive capacities with other semiconductor
companies. Mr. Moorthy holds an M.B.A. in Marketing from
National University, a B.S. degree in Electrical Engineering from the
University of Washington and a B.S. degree in Physics from the University of
Bombay.
Mr.
Drehobl has served as Vice President of the Security, Microcontroller, and
Technology Division since July 2001. He has been employed by Microchip since
August 1989 and has served as a Vice President in various roles since February
1997. Mr. Drehobl holds a Bachelor of Technology degree from the
University of Dayton.
Mr.
Lambert has served as Vice President, Fab Operations since November
1993. From 1991 to November 1993, he served as Director of
Manufacturing Engineering, and from 1989 to 1991, he served as Engineering
Manager of Fab Operations. Mr. Lambert holds a B.S. degree in
Chemical Engineering from the University of Cincinnati.
Mr.
Little has served as Vice President, Worldwide Sales and Applications since
July 2000. He has been employed by Microchip since 1989 and has
served as a Vice President in various roles since September 1993. Mr.
Little holds a B.S. degree in Engineering Technology from United Electronics
Institute.
Mr.
Parnell has served as Vice President and Chief Financial Officer since May
2000. He served as Vice President, Controller and Treasurer from
April 1993 to May 2000. Mr. Parnell holds a finance/accounting
qualification with the Association of Certified Accountants from Edinburgh
College, Scotland.
Mr.
Simoncic has served as Vice President, Analog and Interface Products
Division since September 1999. From October 1995 to September 1999 he
served as Vice President in various roles. Joining Microchip in 1990,
Mr. Simoncic held various roles in Design, Device/Yield Engineering and Quality
Systems. Mr. Simoncic holds a B.S. degree in Electrical Engineering
Technology from DeVry Institute of Technology.
|
Item
1A.
|
RISK
FACTORS
|
When
evaluating Microchip and its business, you should give careful consideration
to
the factors listed below, in addition to the information provided elsewhere
in
this Form 10-K and in other documents that we file with the Securities and
Exchange Commission.
10
Our
quarterly operating results may fluctuate due to factors that could reduce
our
net sales and profitability.
Our
quarterly operating results are affected by a wide variety of factors that
could
reduce our net sales and profitability, many of which are beyond our
control. Some of the factors that may affect our quarterly operating
results include:
|
|
·
|
changes
in demand or market acceptance of our products and products of
our
customers
|
|
|
·
|
levels
of inventories at our customers
|
|
|
·
|
the
mix of inventory we hold and our ability to satisfy orders from
our
inventory
|
|
|
·
|
changes
in utilization of our manufacturing capacity and fluctuations in
manufacturing yields
|
|
|
·
|
our
ability to secure sufficient assembly and testing
capacity
|
|
|
·
|
availability
of raw materials and equipment
|
|
|
·
|
competitive
developments including pricing
pressures
|
|
|
·
|
the
level of orders that are received and can be shipped in a
quarter
|
|
|
·
|
the
level of sell-through of our products through
distribution
|
|
|
·
|
changes
or fluctuations in customer order patterns and
seasonality
|
|
|
·
|
constrained
availability from other electronic suppliers impacting our customers’
ability to ship their products, which in turn may adversely impact
our
sales to those customers
|
|
|
·
|
costs
and outcomes of any tax audits or any litigation involving intellectual
property, customers or other issues
|
|
|
·
|
disruptions
in our business or our customers’ businesses due to terrorist activity,
armed conflict, war, worldwide oil prices and supply, public health
concerns or disruptions in the transportation
system
|
|
|
·
|
property
damage or other losses which are not covered by
insurance
|
|
|
·
|
general
economic, industry or political conditions in the United States
or
internationally
|
We
believe that period-to-period comparisons of our operating results are not
necessarily meaningful and that you should not rely upon any such comparisons
as
indications of future performance. In future periods our operating
results may fall below our public guidance or the expectations of public market
analysts and investors, which would likely have a negative effect on the price
of our common stock.
Our
operating results will suffer if we ineffectively utilize our manufacturing
capacity or fail to maintain manufacturing yields.
The
manufacture and assembly of integrated circuits, particularly non-volatile,
erasable CMOS memory and logic devices such as those that we produce, are
complex processes. These processes are sensitive to a wide variety of
factors, including the level of contaminants in the manufacturing environment,
impurities in the materials used, the performance of our wafer fabrication
personnel and equipment, and other quality issues. As is typical in
the semiconductor industry, we have from time to time experienced lower than
anticipated manufacturing yields. Our operating results will suffer
if we are unable to maintain yields at approximately the current
levels. This could include delays in the recognition of revenue, loss
of revenue or future orders, and customer-imposed penalties for failure to
meet
contractual shipment deadlines.
Our
operating results are also adversely affected when we operate at less than
optimal capacity. Lower capacity utilization results in certain costs
being charged directly to expense and lower gross margins.
We
are dependent on orders that are received and shipped in the same quarter and
are therefore limited in our visibility of future product
shipments.
Our
net
sales in any given quarter depend upon a combination of shipments from backlog
and orders received in that quarter for shipment in that quarter, which we
refer
to as turns orders. We measure turns orders at the beginning of a
quarter based on the orders needed to meet the shipment targets that we set
entering the quarter. Historically, we have proven our ability to
respond quickly to customer orders as part of our competitive strategy,
resulting in customers placing orders with relatively short delivery
schedules. Shorter lead times generally mean that turns orders as a
percentage of our business are relatively high in any particular quarter and
reduces our backlog visibility on future product shipments. Turns
orders correlate to overall semiconductor industry conditions and product lead
times. Because turns orders are difficult to predict, varying levels
of turns orders make our net sales more difficult to forecast. If we
do not achieve a sufficient level of turns orders in a particular quarter
relative to our revenue targets, our revenue and operating results may
suffer.
Intense
competition in the markets we serve may lead to pricing pressures, reduced
sales
of our products or reduced market share.
The
semiconductor industry is intensely competitive and has been characterized
by
price erosion and rapid technological change. We compete with major
domestic and international semiconductor companies, many of which have greater
market recognition and substantially greater financial, technical, marketing,
distribution and other resources than we do with which to pursue engineering,
manufacturing, marketing and distribution of their products. We may
be unable to compete successfully in the future, which could harm our
business.
11
Our
ability to compete successfully depends on a number of factors both within
and
outside our control, including, but not limited to:
|
|
·
|
the
quality, performance, reliability, features, ease of use, pricing
and
diversity of our products
|
|
|
·
|
our
success in designing and manufacturing new products including those
implementing new technologies
|
|
|
·
|
the
rate at which customers incorporate our products into their own
applications
|
|
|
·
|
product
introductions by our competitors
|
|
|
·
|
the
number, nature and success of our competitors in a given
market
|
|
|
·
|
our
ability to obtain adequate supplies of raw materials and other
supplies at
acceptable prices
|
|
|
·
|
our
ability to protect our products and processes by effective utilization
of
intellectual property rights
|
|
|
·
|
the
quality of our customer service and our ability to address the
needs of
our customers, and
|
|
|
·
|
general
market and economic conditions.
|
Historically,
average selling prices in the semiconductor industry decrease over the life
of
any particular product. The overall average selling prices of our
microcontroller and proprietary analog and interface products have remained
relatively constant, while average selling prices of our Serial EEPROM and
non-proprietary analog and interface products have declined over
time.
We
have
experienced, and expect to continue to experience, modest pricing declines
in
certain of our more mature proprietary product lines, due primarily to
competitive conditions. We have been able to moderate average selling
price declines in many of our proprietary product lines by continuing to
introduce new products with more features and higher prices. We have
experienced in the past and expect to continue to experience in the future
varying degrees of competitive pricing pressures in our Serial EEPROM and
non-proprietary analog products.
We
may be
unable to maintain average selling prices for our products as a result of
increased pricing pressure in the future, which could adversely impact our
operating results.
Our
business is dependent on selling through
distributors.
Sales
through distributors accounted for 65% of our net sales in fiscal 2007, 2006
and
2005. Our two largest distributors together accounted for
approximately 21% of our net sales in fiscal 2007, approximately 24% of our
net
sales in fiscal 2006 and approximately 25% of our net sales in fiscal
2005. We do not have long-term agreements with our distributors and
both we and our distributors may each terminate our relationship with little
or
no advanced notice. We believe that customers recognize Microchip for
its products and brand name and use distributors as an effective supply
channel.
During
fiscal 2006, we reduced the gross margin that certain of our distributors earn
when they sell our products. We reduced these distributors’ gross
margins because we believed these distributors did not have sufficient technical
sales resources to properly address the marketplace for our
products. Since fiscal 2006, we have added a significant number of
technical sales employees throughout our worldwide sales organization to address
the support requirements for both our OEM and distribution
customers. Although these actions have not had a material adverse
impact on the overall effectiveness of our distribution channel, there can
be no
assurance that there will not be an adverse impact in the future.
The
loss
of, or a disruption in the operations of, one or more of our distributors could
reduce our net sales in a given period and could result in an increase in
inventory returns.
Our
success depends on our ability to introduce new products on a timely
basis.
Our
future operating results will depend on our ability to develop and introduce
new
products on a timely basis that can compete effectively on the basis of price
and performance and which address customer requirements. The success
of our new product introductions depends on various factors, including, but
not
limited to:
|
|
·
|
proper
new product selection
|
|
|
·
|
timely
completion and introduction of new product
designs
|
|
|
·
|
development
of support tools and collateral literature that make complex new
products
easy for engineers to understand and use,
and
|
|
|
·
|
market
acceptance of our customers’ end
products.
|
12
Because
our products are complex, we have experienced delays from time to time in
completing development of new products. In addition, our new products
may not receive or maintain substantial market acceptance. We may be
unable to design, develop and introduce competitive products on a timely basis,
which could adversely impact our future operating results.
Our
success also depends upon our ability to develop and implement new design and
process technologies. Semiconductor design and process technologies
are subject to rapid technological change and require significant R&D
expenditures. We and other companies in the industry have, from time
to time, experienced difficulties in effecting transitions to advanced process
technologies and, consequently, have suffered reduced manufacturing yields
or
delays in product deliveries. Our future operating results could be
adversely affected if any transition to future process technologies is
substantially delayed or inefficiently implemented.
We
must attract and retain qualified personnel to be successful, and competition
for qualified personnel is intense in our market.
Our
success depends upon the efforts and abilities of our senior management,
engineering and other personnel. The competition for qualified
engineering and management personnel is intense. We may be
unsuccessful in retaining our existing key personnel or in attracting and
retaining additional key personnel that we require. The loss of the
services of one or more of our key personnel or the inability to add key
personnel could harm our business. We have no employment agreements
with any member of our senior management team. As a result of the
anticipated impact that the adoption of SFAS No. 123R in our first quarter
of
2007 would have on our results of operations, we changed our equity
compensation program during fiscal 2006. We now grant fewer equity
based shares per employee and the type of equity instrument is generally
restricted stock units rather than stock
options. This change in our equity compensation program may make it
more difficult for us to attract or retain qualified management and engineering
personnel, which could have an adverse effect on our business.
We
are dependent on several contractors to perform key manufacturing functions
for
us.
We
use
several contractors located in Asia for a portion of the assembly and testing
of
our products. We also rely on outside wafer foundries for a portion
of our wafer fabrication. Although we own the majority of our
manufacturing resources, the disruption or termination of any of our contractors
could harm our business and operating results.
Our
use
of third parties involves some reduction in our level of control over the
portions of our business that we subcontract. Our future operating
results could suffer if any contractor were to experience financial, operations
or production difficulties or situations when demand exceeds capacity, or if
they were unable to maintain manufacturing yields, assembly and test yields
and
costs at approximately their current levels, or if due to their locations in
foreign countries they were to experience political upheaval or infrastructure
disruption. Further, procurement from third parties is done by
purchase order and contracts. If these third parties are unable or
unwilling to timely deliver products or services conforming to our quality
standards, we may not be able to qualify additional manufacturing sources for
our products in a timely manner or at all, and such arrangements, if any, may
not be on favorable terms to us. In such event, we could experience
an interruption in production, an increase in manufacturing and production
costs, decline in product reliability, and our business and operating results
could be adversely affected.
We
may lose sales if our suppliers of raw materials and equipment fail to meet
our
needs.
Our
semiconductor manufacturing operations require raw materials and equipment
that
must meet exacting standards. We generally have more than one source
for these supplies, but there are only a limited number of suppliers capable
of
delivering various raw materials and equipment that meet our
standards. The raw materials and equipment necessary for our business
could become more difficult to obtain as worldwide use of semiconductors in
product applications increases. We have
experienced supply shortages from time to time in the past, and on occasion
our
suppliers have told us they need more time than expected to fill our orders
or
that they will no longer support certain equipment with updates or spare and
replacements parts. An interruption of any raw materials or equipment
sources, or the lack of supplier support for a particular piece of equipment,
could harm our business.
Our
operating results may be impacted by both seasonality and the wide fluctuations
of supply and demand in the semiconductor industry.
The
semiconductor industry is characterized by seasonality and wide fluctuations
of
supply and demand. Since a significant portion of our revenue is from
consumer markets and international sales, our business may be subject to
seasonally lower revenues in particular quarters of our fiscal
year. However, broad strength in our overall business in recent
periods and semiconductor industry conditions have had a more significant impact
on our results than seasonality, and has made it difficult to assess the impact
of seasonal factors on our business. The industry has also experienced
significant economic downturns, characterized by diminished product demand
and
production over-capacity. We have sought to reduce our exposure to
this industry cyclicality by selling proprietary products that cannot be easily
or quickly replaced, to a
13
We
are exposed to various risks related to legal proceedings or
claims.
We
are
currently, and in the future may be, involved in legal proceedings or claims
regarding patent infringement, intellectual property rights, contracts and
other
matters. We were involved in patent infringement litigation with
Philips Corporation which was settled in fiscal 2005. As is typical
in the semiconductor industry, we receive notifications from customers from
time
to time who believe that we owe them indemnification or other obligations
related to infringement claims made against the customers by third
parties. These legal proceedings and claims, whether with or without
merit, could result in substantial cost to us and divert our
resources. If we are not able to resolve a claim, negotiate a
settlement of a matter, obtain necessary licenses on commercially reasonable
terms, reengineer our products or processes to avoid infringement, and/or
successfully prosecute or defend our position, we could incur uninsured
liability in any of them, be required to take an appropriate charge to
operations, be enjoined from selling a material portion of our product line
or
using certain processes, suffer a reduction or elimination in value of
inventories, and our business, financial condition or results of
operations could be harmed.
It
is
also possible that from time to time we may be subject to warranty or product
liability claims that could lead to significant expenses related to the defense
of such claims, diversion of resources, increased costs associated with the
replacement of affected products, lost revenue or delay in recognition of
revenue due to cancellation of orders and unpaid receivables, customer imposed
fines or penalties for failure to meet contractual requirements, and a
requirement to pay damages claims. Because the systems into which our
products are integrated have a higher cost of goods than the products we sell,
these expenses and damages may be significantly higher than the sales and
profits we received from the products involved. While we specifically
exclude consequential damages in our standard terms and conditions, our ability
to avoid such liabilities may be limited by applicable law. We do
have product liability insurance, but there is no certainty that insurance
will
cover all claims or be of a sufficient amount to fully protect against such
claims. Costs or payments we may make in connection with warranty or
product liability claims may adversely affect the results of our
operations.
Further,
we sell to customers in industries such as automotive, aerospace, and medical,
where failure of their systems could cause damage to property or persons. We
may
be subject to product liability claims if our products cause the system
failures. Based on our historical experience, we believe that the risk of
exposure to product liability claims is currently low. However, we will face
increased exposure to product liability claims if there are substantial
increases in either the volume of our sales into these applications or the
frequency of system failures caused by our devices.
Failure
to adequately protect our intellectual property could result in lost revenue
or
market opportunities.
Our
ability to obtain patents, licenses and other intellectual property rights
covering our products and manufacturing processes is important for our
success. To that end, we have acquired certain patents and patent
licenses and intend to continue to seek patents on our inventions and
manufacturing processes. The process of seeking patent protection can
be long and expensive, and patents may not be issued from currently pending
or
future applications. In addition, our existing patents and any new
patents that are issued may not be of sufficient scope or strength to provide
meaningful protection or any commercial advantage to us. We may be
subject to or may ourselves initiate interference proceedings in the U.S. Patent
and Trademark Office, which can require significant financial and management
resources. In addition, the laws of certain foreign countries
do not protect our intellectual property rights to the same extent as the laws
of the United States. Infringement of our intellectual property
rights by a third party could result in uncompensated lost market and revenue
opportunities for us.
We
do not typically have long-term contracts with our
customers.
We
do not
typically enter into long-term contracts with our customers and we cannot be
certain about future order levels from our customers. When we do
enter into customer contracts, the contract is generally cancelable at the
convenience of the customer. Even though we have over 56,000 end
customers and our ten largest customers make up approximately 10% of our total
revenue, cancellation of long-term and short-term customer contracts could
have
an adverse financial impact on our revenue and profits.
Further,
as the practice has become more commonplace in the industry, we have entered
into contracts with certain customers that differ from our standard terms of
sale. Under these contracts we commit to supply quantities of
products on scheduled delivery dates. If we become unable to supply
the customer as required under the contract, the customer may incur additional
production costs, lost revenues due to subsequent delays in their own
manufacturing schedule, or quality related issues. Under these
contracts, we may be liable for the costs the customer has
incurred. While we try to limit such liabilities, if they should
arise, there may be a material adverse impact on our results of operation and
financial condition.
14
Business
interruptions could harm our business.
Operations
at any of our manufacturing facilities, or at any of our wafer fabrication
or
test and assembly subcontractors, may be disrupted for reasons beyond our
control, including work stoppages, power loss, incidents of terrorism or
security risk, political instability, public health issues, telecommunications,
transportation or other infrastructure failure, fire, earthquake, floods, or
other natural disasters. If operations at any of our facilities, or
our subcontractors’ facilities are interrupted, we may not be able to shift
production to other facilities on a timely basis. If this occurs, we
would likely experience delays in shipments of products to our customers and
alternate sources for production may be unavailable on acceptable
terms. This could result in reduced revenues and profits and the
cancellation of orders or loss of customers. In addition, business
interruption insurance will likely not be enough to compensate us for any losses
that may occur and any losses or damages incurred by us as a result of business
interruptions could significantly harm our business.
We
are highly dependent on foreign sales and operations, which exposes us to
foreign political and economic risks.
Sales
to
foreign customers account for a substantial portion of our net
sales. During fiscal 2007 and 2006, approximately 74% of our net
sales were made to foreign customers. We purchase a substantial
portion of our raw materials and equipment from foreign suppliers. In
addition, we own product assembly and testing facilities located near Bangkok,
Thailand. We also use various foreign contractors for a portion of
our assembly and testing and for a portion of our wafer fabrication
requirements. Substantially all of our finished goods inventory is
maintained in Thailand.
Our
reliance on foreign operations, foreign suppliers, maintenance of substantially
all of our finished goods in inventory at foreign locations and significant
foreign sales exposes us to foreign political and economic risks, including,
but
not limited to:
|
|
·
|
political,
social and economic instability
|
|
|
·
|
public
health conditions
|
|
|
·
|
trade
restrictions and changes in tariffs
|
|
|
·
|
import
and export license requirements and
restrictions
|
|
|
·
|
difficulties
in staffing and managing international
operations
|
|
|
·
|
employment
regulations
|
|
|
·
|
disruptions
in international transport or
delivery
|
|
|
·
|
fluctuations
in currency exchange rates
|
|
|
·
|
difficulties
in collecting receivables
|
|
|
·
|
economic
slowdown in the worldwide markets served by us,
and
|
|
|
·
|
potentially
adverse tax consequences.
|
If
any of
these risks materialize, our sales could decrease and our operating results
could suffer.
Interruptions
in information technology systems could affect our
business.
We
rely
on the efficient and uninterrupted operation of complex information technology
systems and networks to operate our business. Any significant system
or network disruption, including but not limited to computer viruses, security
breaches, or
energy blackouts
could have a material adverse impact on our operations, sales and operating
results. We have implemented measures to manage our risks
related to such disruptions, but such disruptions could negatively impact our
operations and financial results. In addition, we may incur
additional costs to remedy the damages caused by these disruptions or security
breaches.
The
occurrence of events for which we are self-insured, or which exceed our
insurance limits may affect our profitability and
liquidity.
We
have
insurance contracts with independent insurance companies related to many
different types of risk; however, we self-insure for some risks and
obligations. In these circumstances, we have determined that it is
more cost effective to self-insure certain risks than to pay the increased
premium costs in place since the disruption in the insurance market after the
events of September 11, 2001. The risks and exposures that we
self-insure include, but are not limited to, certain property product defects,
political risks, and patent infringement. Should there be a loss or
adverse judgment or other decision in an area for which we are self-insured,
then our financial condition, result of operations and liquidity may be
adversely affected.
We
are subject to stringent environmental regulations, which may force us to incur
significant expenses.
We
must
comply with many different federal, state, local and foreign governmental
regulations related to the use, storage, discharge and disposal of toxic,
volatile or otherwise hazardous chemicals used in our products and manufacturing
process. Although we believe that our activities conform to presently
applicable environmental regulations, our failure to
15
Over
the
past few years, there has been an expansion in environmental laws focusing
on
reducing or eliminating hazardous substances in electronic products. For
example, the EU RoHS Directive provided that beginning July 1, 2006, electronic
products sold into Europe were required to meet stringent chemical restrictions,
including the absence of lead. China is adopting similar
requirements. The first phase of the China legislation requires labeling
and chemical content disclosure for all electronic products sold into or within
China after February 28, 2007. While at this time
our semiconductor products do not directly fall under the China
legislation, we have complied with it in order to support our customers' compliance
efforts. As the law is further implemented, we may need to take additional
compliance activities. These laws impact our products and may make it more
expensive to manufacture and sell our products. It may be difficult to
timely comply with these laws and we may not have sufficient quantities of
compliant materials to meet customers’ needs, thereby adversely impacting our
sales and profitability.
Regulatory
authorities in jurisdictions into which we ship our products could levy fines
or
restrict our ability to export products.
A
significant portion of our sales are made outside of the United States through
exporting and re-exporting of products. In addition to local
jurisdictions’ export regulations, our U.S. manufactured products or products
based on U.S. technology are subject to Export Administration Regulations
(“EAR”) when exported and re-exported to and from all international
jurisdictions. Licenses or proper license exceptions may be required
for the shipment of our products to certain countries. Non-compliance
with the EAR or other export regulations can result in penalties including
denial of export privileges, fines, criminal penalties, and seizure of
products. Such penalties could have a material adverse effect on our
business including our ability to meet our net sales and earnings
targets.
The
future trading price of our common stock could be subject to wide fluctuations
in response to a variety of factors.
The
market price of our common stock has fluctuated significantly in the past and
is
likely to fluctuate in the future. The future trading price of our
common stock could be subject to wide fluctuations in response to a variety
of
factors, many of which are beyond our control, including, but not limited
to:
|
|
·
|
quarterly
variations in our operating results and the operating results of
other
technology companies
|
|
|
·
|
actual
or anticipated announcements of technical innovations or new products
by
us or our competitors
|
|
|
·
|
changes
in analysts’ estimates of our financial performance or buy/sell
recommendations
|
|
|
·
|
changes
in our financial guidance or our failure to meet such
guidance
|
|
|
·
|
general
conditions in the semiconductor industry,
and
|
|
|
·
|
worldwide
economic and financial
conditions.
|
In
addition, the stock market has experienced significant price and volume
fluctuations that have particularly affected the market prices for many high
technology companies and that often have been unrelated to the operating
performance of such companies. These broad market fluctuations and
other factors may harm the market price of our common stock.
The
outcome of currently ongoing and future examinations of our income tax returns
by the IRS could have an adverse effect on our results of
operations.
We
are
subject to continued examination of our income tax returns by the Internal
Revenue Service and other tax authorities. We regularly assess the likelihood
of
adverse outcomes resulting from these examinations to determine the adequacy
of
our provision for income taxes. There can be no assurance that the outcomes
from
these continuing examinations will not have an adverse effect on our future
operating results.
In
the event we make acquisitions, we may not be able to successfully integrate
such acquisitions or attain the anticipated benefits.
While
acquisitions do not represent a major part of our growth strategy, from time
to
time we may consider financially attractive and strategic acquisitions if such
opportunities arise. Any transactions that we complete may involve a number
of
risks, including: the diversion of our management’s attention from
our existing business to integrate the operations and personnel of the acquired
business, or possible adverse effects on our operating results during the
integration process. In addition, we may not be able to successfully
or profitably integrate, operate, maintain and manage any newly acquired
operations
or employees. We may not be able to maintain uniform standards, controls,
procedures and policies, and this may lead to operational
inefficiencies.
16
Item
1B. UNRESOLVED
STAFF COMMENTS
None.
Item
2. PROPERTIES
At
March
31, 2007, we owned the facilities described below:
|
Location
|
Approximate
Total
Sq. Ft.
|
Uses
|
|
Chandler,
Arizona
|
415,000
|
Executive
and Administrative Offices; Wafer Probe; R&D Center; Sales and
Marketing; and Computer and Service Functions
|
|
Tempe,
Arizona
|
379,000
|
Wafer
Fabrication (Fab 2); R&D Center; Administrative
Offices; and Warehousing
|
|
Puyallup,
Washington (1)
|
700,000
|
Wafer
Fabrication (Fab 3); R&D Center; Administrative
Offices; and Warehousing (non-operational;
held-for-future-use)
|
|
Gresham,
Oregon
|
826,500
|
Wafer
Fabrication (Fab 4), R&D Center, Administrative
Offices, and Warehousing
|
|
Chacherngsao,
Thailand (2)
|
290,000
|
Test
and Assembly; Wafer Probe; Sample Center; Warehousing; and Administrative
Offices
|
(1) Currently
non-operational and being held-for-future-use. Fab 3 consists of
manufacturing buildings and land, with no equipment.
(2) Located
in the Alphatechnopolis Industrial Park near Bangkok on land to which we
expect
to acquire title in accordance with our agreement with the landowner. Progress towards
obtaining full title of the land has been delayed due to a bankruptcy relating
to the seller of the land. We are currently working with the
creditors in an attempt to reach resolution on this matter. At this
time it is not possible to estimate when, or if, full title transfer will
be
completed. We have provided reserves that we estimate will be
adequate to obtain full title. Such reserves are set at the estimated
fair value of the land.
In
addition to the facilities we own, we lease several research and development
facilities and sales offices in North America, Europe and Asia. Our
aggregate monthly rental payment for our leased facilities is approximately
$0.4 million.
We currently believe that our existing facilities will be adequate to meet our production requirements for the next 12 months.
|
Item
3.
|
LEGAL
PROCEEDINGS
|
In
the
ordinary course of our business, we are involved in a limited number of legal
actions, both as plaintiff and defendant, and could incur uninsured liability
in
any one or more of them. Although the outcome of these actions is not
presently determinable, we believe that the ultimate resolution of these
matters
will not harm our business and will not have a material adverse effect on
our
financial position, cash flows or results of operations. Litigation
relating to the semiconductor industry is not uncommon, and we are, and from
time to time have been, subject to such litigation. No assurances can
be given with respect to the extent or outcome of any such litigation in
the
future.
|
Item
4.
|
SUBMISSION
OF MATTERS TO A VOTE OF SECURITY
HOLDERS
|
Not
applicable.
17
PART
II
|
Item
5.
|
MARKET
FOR REGISTRANT’S COMMON EQUITY, RELATED STOCKHOLDER MATTERS AND ISSUER
PURCHASES OF EQUITY
SECURITIES
|
Our
common
stock
is traded on the NASDAQ Global Market under the symbol “MCHP.” Our
common stock has been quoted on such market since our initial public offering
on
March 19, 1993. The following table sets forth the quarterly high and
low closing prices of our common stock as reported by NASDAQ for our last
two
fiscal years.
|
Fiscal
2007
|
High
|
Low
|
Fiscal
2006
|
High
|
Low
|
||||||||||||
|
First
Quarter
|
$ |
38.15
|
$ |
31.79
|
First
Quarter
|
$ |
30.68
|
$ |
24.60
|
||||||||
|
Second
Quarter
|
34.88
|
31.11
|
Second
Quarter
|
32.61
|
28.52
|
||||||||||||
|
Third
Quarter
|
34.83
|
31.40
|
Third
Quarter
|
34.64
|
27.30
|
||||||||||||
|
Fourth
Quarter
|
37.49
|
33.21
|
Fourth
Quarter
|
37.74
|
32.13
|
||||||||||||
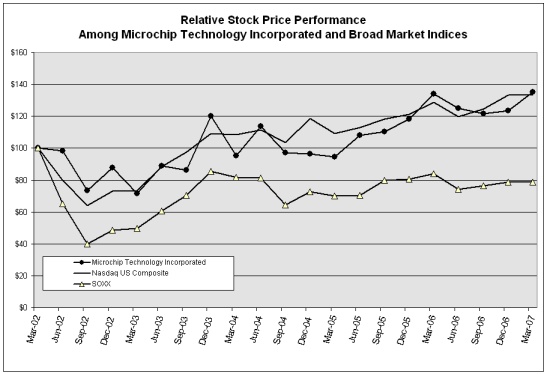
On
May
11, 2007, there were approximately 424 holders of record of our common
stock. This figure does not reflect beneficial ownership of shares
held in nominee names.
We
have
been declaring and paying quarterly cash dividends since the third quarter
of
fiscal 2003. Our total cash dividends paid were $207.9 million,
$120.1 million and $43.0 million in fiscal 2007, 2006 and 2005,
respectively. The following table sets forth our quarterly cash
dividends per common share and the total amount of the dividend payment for
each
quarter in fiscal 2007 and 2006 (amounts in thousands, except per share
amounts).
|
Fiscal
2007
|
Dividends
per
Common
Share
|
Amount
of
Dividend
Payment
|
Fiscal
2006
|
Dividends
per Common Share
|
Amount
of Dividend Payment
|
||||||||||||
|
First
Quarter
|
$ |
0.215
|
$ |
46,064
|
First
Quarter
|
$ |
0.095
|
$ |
19,795
|
||||||||
|
Second
Quarter
|
0.235
|
50,509
|
Second
Quarter
|
0.125
|
26,172
|
||||||||||||
|
Third
Quarter
|
0.250
|
53,953
|
Third
Quarter
|
0.160
|
33,645
|
||||||||||||
|
Fourth
Quarter
|
0.265
|
57,374
|
Fourth
Quarter
|
0.190
|
40,492
|
||||||||||||
18
On
April 26, 2007, we declared a
quarterly cash dividend of $0.28 per share, which will be paid on May 24,
2007
to stockholders of record on May 10, 2007 and the total amount of such dividend
is expected to be $60.9 million. Our Board is free to change its
dividend practices at any time and to decrease or increase the dividend paid,
or
not to pay a dividend, on our common stock on the basis of our results of
operations, financial condition, cash requirements and future prospects,
and
other factors deemed relevant by our Board. Our current intent is to
provide for ongoing quarterly cash dividends depending upon market conditions
and our results of operations.
On
October 25, 2006, our Board of Directors authorized the repurchase of up
to
10,000,000 shares of our common stock in the open market or privately negotiated
transactions. As of March 31, 2007, all shares related to this
authorization remained available for purchase under this program. On
April 22, 2004, our Board of Directors authorized the repurchase of up to
2,500,000 shares of our common stock in the open market or privately negotiated
transactions. As of March 31, 2007, 1,495,166 shares related to this
authorization remained available for purchase under this program. We did not
repurchase any shares of our common stock in fiscal 2007.
Please
refer to “Item 12, Security Ownership Of Certain Beneficial Owners And
Management And Related Stockholder Matters,” at page 38 below, for the
information required by Item 201(d) of Regulation S-K with respect to securities
authorized for issuance under our equity compensation plans at March 31,
2007.
|
Item
6.
|
SELECTED
FINANCIAL DATA
|
You
should read the following selected consolidated financial data for the five-year
period ended March 31, 2007 in conjunction with our Consolidated Financial
Statements and Notes thereto and, “Management’s Discussion and Analysis of
Financial Condition and Results of Operations” included in Items 7 and 8 of this
Form 10-K. Our consolidated statements of income data for each of the
years in the three-year period ended March 31, 2007, and the balance sheet
data
as of March 31, 2007 and 2006, are derived from our audited consolidated
financial statements, included in Item 8 of this Form 10-K. The statements
of
operations data for the years ended March 31, 2004 and 2003 and balance sheet
data as of March 31, 2005, 2004 and 2003 have been derived from our consolidated
audited financial statements not included herein (for information below all
amounts are in thousands, except per share data).
Statement
of Income Data:
|
March
31,
|
||||||||||||||||||||
|
2007
|
2006
|
2005
|
2004
|
2003
|
||||||||||||||||
|
Net
sales
|
$ |
1,039,671
|
$ |
927,893
|
$ |
846,936
|
$ |
699,260
|
$ |
651,462
|
||||||||||
|
Cost
of sales
|
414,915
|
377,016
|
362,961
|
349,301
|
299,227
|
|||||||||||||||
|
Research
and development
|
113,698
|
94,926
|
93,040
|
85,389
|
87,963
|
|||||||||||||||
|
Selling,
general and administrative
|
163,247
|
129,587
|
111,188
|
92,411
|
89,355
|
|||||||||||||||
|
Special
charges (1)
|
---
|
---
|
21,100
|
865
|
50,800
|
|||||||||||||||
|
Operating
income
|
347,811
|
326,364
|
258,647
|
171,294
|
124,117
|
|||||||||||||||
|
Interest
income (expense), net
|
52,967
|
30,786
|
16,864
|
4,639
|
3,344
|
|||||||||||||||
|
Other
income (expense), net
|
312
|
2,035
|
1,757
|
1,963
|
871
|
|||||||||||||||
|
Income
before income taxes
|
401,090
|
359,185
|
277,268
|
177,896
|
128,332
|
|||||||||||||||
|
Income
tax provision
|
44,061
|
116,816
|
63,483
|
40,634
|
28,657
|
|||||||||||||||
|
Income
before cumulative effect ofchange in accounting principle
|
357,029
|
242,369
|
213,785
|
137,262
|
99,675
|
|||||||||||||||
|
Cumulative
effect of change inaccounting principle (2)
|
---
|
---
|
---
|
---
|
11,443
|
|||||||||||||||
|
Net
income
|
$ |
357,029
|
$ |
242,369
|
$ |
213,785
|
$ |
137,262
|
$ |
88,232
|
||||||||||
|
Basic
net income per common share
|
$ |
1.66
|
$ |
1.15
|
$ |
1.03
|
$ |
0.67
|
$ |
0.44
|
||||||||||
|
Diluted
net income per common share
|
$ |
1.62
|
$ |
1.13
|
$ |
1.01
|
$ |
0.65
|
$ |
0.42
|
||||||||||
|
Dividends
declared per common share
|
$ |
0.965
|
$ |
0.570
|
$ |
0.208
|
$ |
0.113
|
$ |
0.040
|
||||||||||
|
Basic
common shares outstanding
|
215,498
|
210,104
|
206,740
|
206,032
|
202,483
|
|||||||||||||||
|
Diluted
common shares outstanding
|
220,848
|
215,024
|
211,962
|
212,172
|
210,646
|
|||||||||||||||
19
Balance
Sheet Data:
|
March
31,
|
||||||||||||||||||||
|
2007
|
2006
|
2005
|
2004
|
2003
|
||||||||||||||||
|
Working
capital
|
$ |
828,817
|
$ |
509,860
|
$ |
768,683
|
$ |
613,894
|
$ |
393,979
|
||||||||||
|
Total
assets
|
2,269,541
|
2,350,596
|
1,817,554
|
1,622,143
|
1,428,275
|
|||||||||||||||
|
Long-term
obligations, less current portion
|
---
|
---
|
---
|
---
|
---
|
|||||||||||||||
|
Stockholders’
equity
|
2,004,368
|
1,726,189
|
1,485,734
|
1,320,517
|
1,178,949
|
|||||||||||||||
|
|
(1)
|
There
were no special charges during the fiscal years ended March 31,
2007 and
2006. Detailed discussions of the special charges for the
fiscal year ended March 31, 2005 are contained in Note 2 to our
Consolidated Financial Statements. Detailed explanations of the
special charges for the fiscal year ended March 31, 2004 and 2003 are
provided below. The following table presents a summary of
special charges for the five-year period ended March 31,
2007:
|
|
Year
ended March 31,
|
||||||||||||||||||||
|
2007
|
2006
|
2005
|
2004
|
2003
|
||||||||||||||||
|
Intellectual
property settlement
|
$ |
---
|
$ |
---
|
$ |
21,100
|
$ |
---
|
$ |
---
|
||||||||||
|
Contract
cancellation, severance and other costs related to Fab 1
closure
|
---
|
---
|
---
|
865
|
---
|
|||||||||||||||
|
Fab
3 impairment charge
|
---
|
---
|
---
|
---
|
41,500
|
|||||||||||||||
|
In-process
research and development charge
|
---
|
---
|
---
|
---
|
9,300
|
|||||||||||||||
|
Totals
|
$ |
---
|
$ |
---
|
$ |
21,100
|
$ |
865
|
$ |
50,800
|
||||||||||
|
|
(2)
|
We
changed our revenue recognition policy as it relates to Asia regional
distributors during fiscal 2003.
|
Fiscal
2004
Closure
of Fab 1
On
April
7, 2003, we announced our intention to close our Chandler, Arizona (Fab 1)
wafer
fabrication facility and integrate certain Fab 1 personnel and processes
into
its Tempe, Arizona (Fab 2) wafer fabrication facility. We completed
this integration process during the three-month period ended June 30,
2003. The closure of Fab 1 and the integration of certain Fab 1
personnel into Fab 2 operations resulted in a reduction in force of 207
employees who were either directly involved in our manufacturing operations
or
provided support functions to Fab 1. The detail of the charges
incurred related to the closure of Fab 1 that were included in cost of
sales for the three-month period ended June 30, 2003 is as follows (amounts
in
thousands):
|
Accelerated
depreciation for Fab 1
|
$ |
30,608
|
||
|
Fab
1 related charges including severance,
|
||||
|
material
and other costs
|
1,147
|
|||
|
Total
charges in cost of sales
|
$ |
31,755
|
The
facility where Fab 1
was located is an integral part of our overall campus in Chandler,
Arizona. Within this same facility resides our wafer probe, mask
making and other manufacturing related activities. Consequently it is
not possible to abandon or otherwise dispose of this facility. We
have accelerated depreciation that was taken only related to assets used
in the
wafer fabrication operations at the facility. We have no specific
plans for utilizing the space formerly housing the wafer fabrication operations,
and intend to leave it in an idle state. The property, plant and
equipment that was subject to the accelerated depreciation is reflected in
the
gross and accumulated depreciation carrying values in the property, plant
and
equipment section of the our balance sheet and related footnote
disclosures.
We
incurred $865,000 of special charges recorded principally for contract
cancellation, severance and other costs related to the closure of Fab 1 and
other actions.
Fiscal
2003
Fab
3
Impairment Charge
During
the September 2002 quarter, we recorded a $41.5 million asset impairment
charge
as described below.
20
During
July 2000, we acquired a semiconductor manufacturing facility in Puyallup,
Washington, referred to as Fab 3. The original purchase consisted of
semiconductor manufacturing facilities and real property. It was our
intention to bring Fab 3 to productive readiness and commence volume production
of 8-inch wafers using its 0.7 and 0.5 micron process technologies by August
2001. Due to deteriorating business conditions in the semiconductor
industry during fiscal 2002, we delayed the intended production start up
of Fab
3. Fab 3 has never been brought to productive readiness.
In
August
2002, we acquired a semiconductor manufacturing facility in Gresham, Oregon,
referred to as Fab 4. After the acquisition of Fab 4 was completed,
we undertook an analysis of the potential production capacity at Fab
4. The results of the production capacity analysis at that time led
us to determine that Fab 3’s capacity would not be needed in the foreseeable
future and during the second quarter of fiscal 2003 we committed to a plan
to
sell Fab 3. Subsequently, we retained a third-party broker to market
Fab 3 on our behalf and began actively seeking potential
buyers. Accordingly, Fab 3 was classified as an asset held-for-sale
as of September 30, 2002 and maintained that classification until March 31,
2005.
Management
determined the value assigned to the Fab 3 assets through various methods
including assistance from a third-party appraisal. The independent
third party used the market approach and considered sales of comparable
properties in determining the fair value of Fab 3. The comparable
sales included eight properties, including our purchases of Fab 3 in July
2000
and Fab 4 in August 2002. Based on the results of this appraisal, we
recorded an asset impairment charge on Fab 3 of $36.9 million, including
estimated costs to sell. The remaining value of $60.2 million was
classified as an asset held-for-sale and was included as a component of other
current assets until March 31, 2005.
During
the quarter ended September 30, 2002, we recorded an asset impairment charge
of
$4.6 million to write-down certain excess manufacturing equipment located
at Fab
3 to its net realizable value of $0.2 million. This manufacturing
equipment became “excess” as a result of duplicate equipment acquired in the
purchase of Fab 4. The net realizable value for the excess
manufacturing equipment was determined based on management
estimates. Substantially all of the other manufacturing equipment
located at Fab 3 has been transferred to and either will be or is
being used in our other wafer fabrication facilities located in Tempe,
Arizona (Fab 2) and Gresham, Oregon (Fab 4).
At
March
31, 2005, we changed the classification of Fab 3 from an asset held-for-sale
to
an asset held-for-future-use. Fab 3 had been on the market for over
two years, and we had not received any acceptable offers on the
facility. Over that period of time, our business had increased
significantly and over the next several years we will need to begin planning
for
future wafer fabrication capacity as a larger percentage of Fab 4’s clean room
capacity is utilized. We determined that the appropriate action to
take was to stop actively marketing the Fab 3 facility and hold it for its
future use. As a result of this change in classification, we had to
assess the fair value of the Fab 3 asset to determine if any additional
impairment charge was required upon the change in classification from
“held-for-sale” to “held-for-future-use” under Statement of Financial Accounting
Standards (“SFAS”) No. 144, Accounting For the Impairment or Disposal of
Long-Lived Assets. We performed a discounted cash flow analysis
of the Fab 3 asset based on various financial projections in developing the
fair
value estimate given that it was the best available valuation technique for
the
asset. The discounted cash flow analysis confirmed the carrying value
of the Fab 3 asset at March 31, 2005 was not in excess of its fair
value. We began to depreciate the Fab 3 asset in April
2005.
PowerSmart
In-Process Research and Development Charge
On
June
5, 2002, we completed the acquisition of PowerSmart, Inc. in which we acquired
all of PowerSmart’s outstanding capital stock and assumed certain stock options
for consideration of $54.0 million in cash plus other acquisition-related
costs
of $1.2 million. The acquisition was accounted for as a purchase
business combination in accordance with SFAS No. 141, Business
Combinations, and accordingly, the results of PowerSmart’s operations are
included in our consolidated
results from the date of the acquisition. The acquisition was not
considered significant under the rules and regulations of the SEC (Rule 3-05
of
Regulation S-X).
The
purchase price was allocated among PowerSmart’s tangible and intangible assets,
in-process research and development and goodwill. Management
determined the value assigned to the assets acquired through various methods
including assistance from a third-party appraisal. An allocation of
$9.3 million of the purchase price was assigned to in-process research and
development and was written off at the date of the acquisition. The
amount paid in excess of the fair value of the net tangible assets was allocated
to separately identifiable intangible assets based upon an independent valuation
analysis. An allocation of $5.6 million of the purchase price was
made to core technology and other identifiable intangible assets and is being
amortized over an estimated useful life of seven years. An allocation
of approximately $32.3 million of the purchase price was made to
goodwill. None of the goodwill is deductible for tax
purposes. The goodwill related to the PowerSmart acquisition was
reduced by $0.4 million to $31.9 million in the year ended March 31, 2005
due to
a favorable settlement of a liability that was recorded as of the original
acquisition date.
21
|
Item
7.
|
MANAGEMENT’S
DISCUSSION AND ANALYSIS OF FINANCIAL CONDITION AND RESULTS OF
OPERATIONS
|
Note
Regarding Forward-looking Statements
This
report, including “Item 1 – Business,” “Item 1A – Risk Factors,” and “Item 7 –
Management’s Discussion and Analysis of Financial Condition and Results of
Operations,” contains certain forward-looking statements that involve risks and
uncertainties, including statements regarding our strategy, financial
performance and revenue sources. We use words such as “anticipate,”
“believe,” “plan,” “expect,” “estimate,” “future,” “intend” and similar
expressions to identify forward-looking statements. These
forward-looking statements include, without limitation, statements regarding
the
following:
|
|
·
|
The
effects and amount of competitive pricing pressure on our product
lines;
|
|
|
·
|
Our
ability to moderate future average selling price
declines;
|
|
|
·
|
The
effect of product mix on gross
margin;
|
|
|
·
|
The
amount of changes in demand for our products and those of our
customers;
|
|
|
·
|
The
level of orders that will be received and shipped within a
quarter;
|
|
|
·
|
The
effect that distributor and customer inventory holding patterns
will have
on us;
|
|
|
·
|
Our
belief that customers recognize our products and brand name and
use
distributors as an effective supply
channel;
|
|
|
·
|
Our
ability to increase the proprietary portion of our analog and interface
product lines and the effect of such an
increase;
|
|
|
·
|
The
impact of any supply disruption we may
experience;
|
|
|
·
|
Our
ability to effectively utilize our facilities at appropriate capacity
levels and anticipated costs;
|
|
|
·
|
That
our existing facilities provide sufficient capacity to respond
to
increases in demand;
|
|
|
·
|
That
manufacturing costs will be reduced by transition to advanced process
technologies;
|
|
|
·
|
Our
ability to absorb fixed costs, labor and other direct manufacturing
costs;
|
|
|
·
|
Our
ability to maintain manufacturing
yields;
|
|
|
·
|
Continuing
our investments in new and enhanced
products;
|
|
|
·
|
The
ability to attract and retain qualified
personnel;
|
|
|
·
|
The
cost effectiveness of using our own assembly and test
operations;
|
|
|
·
|
Our
anticipated level of capital
expenditures;
|
|
|
·
|
Continuing
to seek patents on our inventions;
|
|
|
·
|
Continuation
of quarterly cash dividends;
|
|
|
·
|
The
sufficiency of our existing sources of
liquidity;
|
|
|
·
|
The
impact of seasonality on our
business;
|
|
|
·
|
The
impact of SFAS No. 123R on our
business;
|
|
|
·
|
That
the resolution of legal actions will not harm our
business;
|
|
|
·
|
That
the idling of assets will not impair the value of such
assets;
|
|
|
·
|
The
recoverability of our deferred tax
assets;
|
|
|
·
|
The
adequacy of our tax reserves to offset any potential tax
liabilities;
|
|
|
·
|
Our
belief that the expiration of any tax holidays will not have a
material
impact;
|
|
|
·
|
The
ability to obtain title to our Thailand facility, its fair value
and
adequacy of associated reserves;
|
|
|
·
|
The
accuracy of our estimates of the useful life and values of our
property;
|
|
|
·
|
The
timing and amounts of future contractual
obligations;
|
|
|
·
|
The
effect that expiration of any particular patent may
have;
|
|
|
·
|
Our
ability to obtain intellectual property licenses and minimize the
effects
of litigation;
|
|
|
·
|
The
level of risk we are exposed to for product liability
claims;
|
|
|
·
|
The
amount of labor unrest, political instability, governmental interference
and changes in general economic conditions that we
experience;
|
|
|
·
|
The
effect of increases in market interest rates on income and/or cash
flows;
and
|
|
|
·
|
The
effect of fluctuations in currency
rates.
|
Our
actual results could differ materially from the results anticipated in these
forward-looking statements as a result of certain factors including those
set
forth in “Item 1A – Risk Factors,” and elsewhere in this Form
10-K. Although we believe that the expectations reflected in the
forward-looking statements are reasonable, we cannot guarantee future results,
levels of activity, performance or achievements. You should not place
undue reliance on these forward-looking statements. We disclaim any
obligation to update information contained in any forward-looking
statement.
22
Introduction
The
following discussion should be read in conjunction with the condensed
consolidated financial statements and the related notes that appear elsewhere
in
this document, as well as with other sections of this Annual Report on Form
10-K, including “Item 1 – Business;” “Item 6 – Selected
Financial Data;” and “Item 8 – Financial Statements and Supplementary
Data.”
We
begin
our Management’s Discussion and Analysis of Financial Condition and Results of
Operations (MD&A) with a summary of Microchip’s overall business strategy to
give the reader an overview of the goals of our business and the overall
direction of our business and products. This is followed by a
discussion of the Critical Accounting Policies and Estimates that we believe
are
important to understanding the assumptions and judgments incorporated in
our
reported financial results. In the next section, beginning at page
27, we discuss our Results of Operations for fiscal 2007 compared to fiscal
2006, and for fiscal 2006 compared to fiscal 2005. We then provide an
analysis of changes in our balance sheet and cash flows, and discuss our
financial commitments in sections titled “Liquidity and Capital Resources,”
“Contractual Obligations” and “Off-Balance Sheet Arrangements.”
Strategy
Our
goal
is to be a worldwide leader in providing specialized semiconductor products
for
a wide variety of embedded control applications. Our strategic focus is on
embedded control products, which include microcontrollers, high-performance
linear and mixed signal devices, power management and thermal management
devices, interface devices, Serial EEPROMs, and our patented KEELOQ security
devices. We provide highly cost-effective embedded control products that
also offer the advantages of small size, high performance, low voltage/power
operation and ease of development, enabling timely and cost-effective embedded
control product integration by our customers.
Our
manufacturing operations include wafer fabrication and assembly and test.
The ownership of our manufacturing resources is an important component of
our
business strategy, enabling us to maintain a high level of manufacturing
control
resulting in us being one of the lowest cost producers in the embedded control
industry. By owning our wafer fabrication facilities and much of our
assembly and test operations, and by employing statistical process control
techniques, we have been able to achieve and maintain high production
yields. Direct control over manufacturing resources allows us to shorten
our design and production cycles. This control also allows us to capture
the wafer manufacturing and a portion of the assembly and test profit
margin.
We
employ
proprietary design and manufacturing processes in developing our embedded
control products. We believe our processes afford us both cost-effective
designs in existing and derivative products and greater functionality in
new
product designs. While many of our competitors develop and optimize
separate processes for their logic and memory product lines, we use a common
process technology for both microcontroller and non-volatile memory
products. This allows us to more fully leverage our process research and
development costs and to deliver new products to market more rapidly. Our
engineers utilize advanced computer-aided design (CAD) tools and software
to
perform circuit design, simulation and layout, and our in-house photomask
and
wafer fabrication facilities enable us to rapidly verify design techniques
by
processing test wafers quickly and efficiently.
We
are
committed to continuing our investment in new and enhanced products, including
development systems, and in our design and manufacturing process
technologies. We believe these investments are significant factors in
maintaining our competitive position. Our current research and development
activities focus on the design of new microcontrollers, digital signal
controllers, memory and mixed-signal products, new development systems, software
and application-specific software libraries. We are also developing new
design and process technologies to achieve further cost reductions and
performance improvements in existing products.
We
market
our products worldwide primarily through a network of direct sales personnel
and
distributors. Our distributors focus primarily on servicing the product
and technical support requirements of a broad base of diverse customers.
We believe that our direct sales personnel combined with our distributors
provide an effective means of reaching this broad and diverse customer
base. Our direct sales force focuses primarily on major strategic accounts
in three geographical markets: the Americas, Europe and Asia. We currently
maintain sales and support centers in major metropolitan areas in North America,
Europe and Asia. We believe that a strong technical service presence is
essential to the continued development of the embedded control market.
Many of our field sales engineers (FSEs), field application engineers (FAEs),
and sales management have technical degrees and have been previously employed
in
an engineering environment. We believe that the technical knowledge of our
sales force is a key competitive advantage in the sale of our products.
The primary mission of our FAE team is to provide technical assistance to
strategic accounts and to conduct periodic training sessions for FSEs and
distributor sales teams. FAEs also frequently conduct technical seminars
for our customers in major cities around the world, and work closely with
our
distributors to provide technical assistance and end-user support.
23
Critical
Accounting Policies and Estimates
General
Our
discussion and analysis of Microchip’s financial condition and results of
operations is based upon our Consolidated Financial Statements, which have
been
prepared in accordance with accounting principles generally accepted in the
United States of America. We review the accounting policies we use in
reporting our financial results on a regular basis. The preparation of
these financial statements requires us to make estimates and judgments that
affect the reported amounts of assets, liabilities, revenues and expenses
and
related disclosure of contingent liabilities. On an ongoing basis, we
evaluate our estimates, including those related to revenue recognition,
share-based compensation, inventories, income taxes, property plant and
equipment, impairment of property, plant and equipment and litigation. We
base our estimates on historical experience and on various other assumptions
that are believed to be reasonable under the circumstances, the results of
which
form the basis for making judgments about the carrying value of assets and
liabilities that are not readily apparent from other sources. Results may
differ from these estimates due to actual outcomes being different from those
on
which we based our assumptions. We review these estimates and judgments on
an ongoing basis. We believe the following critical accounting policies
affect our more significant judgments and estimates used in the preparation
of
our consolidated financial statements. We also have other policies that we
consider key accounting policies, such as our policy regarding revenue
recognition to OEMs; however, we do not believe these policies require us
to
make estimates or judgments that are as difficult or subjective as our policies
described below.
Revenue
Recognition– Distributors
Our
distributors worldwide have broad rights to return products and price protection
rights, so we defer revenue recognition until the distributor sells the product
to their customers. We reduce product pricing through price protection
based on market conditions, competitive considerations and other factors.
Price protection is granted to distributors on the inventory that they have
on
hand at the date the price protection is offered. When we reduce the price
of our products, it allows the distributor to claim a credit against its
outstanding accounts receivable balances based on the new price of the inventory
it has on hand as of the date of the price reduction. There is no revenue
impact to us from the price protections. We also grant certain credits to
our distributors. The credits are granted to the distributors on specially
identified pieces of the distributors’ business to allow them to earn a
competitive gross margin on the sale of our products to their end
customers. The credits are on a per unit basis and are not given to the
distributor until they provide documentation of the sale to their end
customer. The effect of granting these credits establishes the net selling
price from us to our distributors for the product and results in the net
revenue
recognized by us when the product is sold by the distributors to their end
customers. Upon our shipment to distributors, amounts billed are included
as accounts receivable, inventory is relieved, and the sale and the gross
margin
are deferred and are reflected as a current liability until the product is
sold
by the distributor to their customers.
Share-based
Compensation
In
the
first quarter of fiscal 2007, we adopted SFAS No. 123R, which requires
the measurement at fair value and recognition of compensation expense for
all
share-based payment awards, including grants of employee stock options, RSUs
and
employee stock purchase rights, to be recognized in our financial statements
based on their respective grant date fair values. Total share-based
compensation in fiscal 2007 was $30.7 million, of which $24.1 million
was reflected in operating expenses, $3.3 million was reflected in cost of
goods sold and $3.3 million was capitalized to inventory.
Determining
the
appropriate fair-value model and calculating the fair value of share-based
awards at the date of grant requires judgment. The fair value of our RSUs
is based on the fair market value of our common stock on the date of grant
discounted for expected future dividends. We use the Black-Scholes option
pricing model to estimate the fair value of employee stock options and
rights to
purchase shares under stock participation plans, consistent with the provisions
of SFAS No. 123R. Option pricing models, including the
Black-Scholes model, also require the use of input assumptions, including
expected volatility, expected life, expected dividend rate, and expected
risk-free rate of return. We use a blend of historical and implied
volatility based on options freely traded in the open market as we believe
this
is more reflective of market conditions and a better indicator of expected
volatility than using purely historical volatility. The expected life of
the awards is based on historical and other economic data trended into
the
future. The risk-free interest rate assumption is based on observed interest
rates appropriate for the terms of our awards. The dividend yield
assumption is based on our history and expectation of future dividend payouts.
SFAS No. 123R requires us to develop an estimate of the number
of share-based awards which will be forfeited due to employee turnover.
Quarterly changes in the estimated forfeiture rate can have a significant
effect on reported share-based compensation, as the effect of adjusting
the rate
for all expense amortization after April 1, 2006 is recognized in the period
the
forfeiture estimate is changed. If the actual forfeiture rate is higher
than the estimated forfeiture rate, then an adjustment is made to increase
the
estimated forfeiture rate, which will result in a decrease to the expense
recognized in the financial statements. If the actual forfeiture rate is
lower than the estimated forfeiture rate,
24
We
evaluate the assumptions used to value our awards on a quarterly basis. If
factors change and we employ different assumptions, share-based compensation
expense may differ significantly from what we have recorded in the past.
If there are any modifications or cancellations of the underlying unvested
securities, we may be required to accelerate, increase or cancel any remaining
unearned share-based compensation expense. Future share-based compensation
expense and unearned share-based compensation will increase to the extent
that
we grant additional equity awards to employees or we assume unvested equity
awards in connection with acquisitions. Had we adopted
SFAS No. 123R in prior periods, the magnitude of the impact of that
standard on our results of operations would have approximated the impact
of
SFAS No. 123 assuming the application of the Black-Scholes option
pricing model as described in the disclosure of pro forma net income and
pro
forma net income per share in Note 14 to our Consolidated Financial
Statements.
Inventories
Inventories
are valued at the lower of cost or market using the first-in, first-out
method. We write down our inventory for estimated obsolescence or
unmarketable inventory in an amount equal to the difference between the cost
of
inventory and the estimated market value based upon assumptions about future
demand and market conditions. If actual market conditions are less
favorable than those we projected, additional inventory write-downs may be
required. Inventory impairment charges establish a new cost basis for
inventory and charges are not subsequently reversed to income even if
circumstances later suggest that increased carrying amounts are
recoverable. In estimating our inventory obsolescence, we primarily
evaluate estimates of demand over a 12-month period and record impairment
charges for inventory on hand in excess of the estimated 12-month
demand.
Income
Taxes
As
part
of the process of preparing our consolidated financial statements, we are
required to estimate our income taxes in each of the jurisdictions in which
we
operate. This process involves estimating our actual current tax exposure
together with assessing temporary differences resulting from differing treatment
of items for tax and accounting purposes. These differences result in
deferred tax assets and liabilities, which are included within our consolidated
balance sheet. We must then assess the likelihood that our deferred tax
assets will be recovered from future taxable income within the relevant
jurisdiction and to the extent we believe that recovery is not likely, we
must
establish a valuation allowance. We have not provided for a valuation
allowance because we believe that it is more likely than not that our deferred
tax assets will be recovered from future taxable income. Should we
determine that we would not be able to realize all or part of our net
deferred
tax asset in the future, an adjustment to the deferred tax asset would be
charged to income in the period such determination was made. At
March 31, 2007, our gross deferred tax asset was
$62.0 million.
Various
taxing authorities in the United States and other countries in which we do
business are increasing their scrutiny of the tax structures employed by
businesses. Companies of our size and complexity are regularly audited by
the taxing authorities in the jurisdictions in which they conduct significant
operations. We are currently under audit by the United States Internal
Revenue Service (“IRS”) for our fiscal years ended March 31, 2002, 2003 and
2004. We recognize liabilities for anticipated tax audit issues in the
United States and other tax jurisdictions based on our estimate of whether,
and
the extent to which, additional tax payments are probable. We believe that
we maintain adequate tax reserves to offset any potential tax liabilities
that
may arise upon these and other pending audits in the United States and other
countries in which we do business. If such amounts ultimately prove to be
unnecessary, the resulting reversal of such reserves would result in tax
benefits being recorded in the period the reserves are no longer deemed
necessary. If such amounts ultimately prove to be less than an ultimate
assessment, a future charge to expense would be recorded in the period in
which
the assessment is determined.
Property,
Plant & Equipment
Property,
plant and equipment are stated at cost. Major renewals and improvements
are capitalized, while maintenance and repairs are expensed when incurred.
At March 31, 2007, the carrying value of our property and equipment totaled
$605.7 million, which represents 26.7% of our total assets. This
carrying value reflects the application of our property and equipment accounting
policies, which incorporate estimates, assumptions and judgments relative
to the
useful lives of our property and equipment. Depreciation is provided on a
straight-line basis over the estimated useful lives of the related assets,
which
range from five to seven years on manufacturing equipment and approximately
30
years on buildings.
25
We
began
production activities at Fab 4 on October 31, 2003. We began to depreciate
the Fab 4 assets as they were placed in service for production purposes.
As of March 31, 2007, all of the buildings and supporting facilities were
being
depreciated as well as the manufacturing equipment that had been placed in
service. All manufacturing equipment that was not
being
used in production activities was maintained in projects in process and is
not
being depreciated until it is placed into service since management believes
there will be no change to its utility from the present time until it is
placed
into productive service. The lives to be used for depreciating this
equipment at Fab 4 will be evaluated at such time as the assets are placed
in
service. We do not believe that the temporary idling of such assets has
impaired the estimated life or carrying values of the underlying
assets.
On
March
31, 2005, we changed the classification of Fab 3 from an asset held-for-sale
to
an asset held-for-future-use. Fab 3 had been on the market for over two
years, and we had not received any acceptable offers on the facility. Over
that period of time, our business had increased significantly and over the
next
several years we will need to begin planning for future wafer fabrication
capacity as a larger percentage of Fab 4’s clean room capacity is
utilized. We determined that the appropriate action to take was to stop
actively marketing the Fab 3 facility and hold it for our future use. As a
result of this change in classification, we had to assess the fair value
of the
Fab 3 asset to determine if any additional impairment charge was required
upon
the change in classification from “held-for-sale” to “held-for-future-use” under
SFAS No. 144. We performed a discounted cash flow analysis of the Fab 3
asset based on various financial projections in developing the fair value
estimate given that it was the best available valuation technique for the
asset. The discounted cash flow analysis confirmed the carrying value of
the Fab 3 asset at March 31, 2005 was not in excess of its fair value. If
indicators of impairment for the Fab 3 assets arise in the future, we will
determine if the sum of the estimated undiscounted cash flows attributable
to
the assets in question are less than their carrying value. If less, we
would recognize an impairment loss on the excess of the carrying amount of
the
assets over their respective fair values. We began to depreciate the Fab 3
asset in April 2005.
The
estimates, assumptions and judgments we use in the application of our property
and equipment policies reflect both historical experience and expectations
regarding future industry conditions and operations. The use of different
estimates, assumptions and judgments regarding the useful lives of our property
and equipment and expectations regarding future industry conditions and
operations, could result in materially different carrying values of assets
and
results of operations.
We
do not
currently hold title to the land on which our Thailand facility resides.
The land is subject to a bankruptcy relating to the seller of the land. We
are currently working with the creditors in attempts to reach resolution
on this
matter. We have provided reserves that we estimate will be adequate
to obtain full title. Such reserves are set at the estimated fair value of
the land. However, timing of the resolution is difficult to predict and
the ultimate amount to be paid could change.
Impairment
of Property, Plant and Equipment
We
assess
whether indicators of impairment of long-lived assets are present. If such
indicators are present, we determine whether the sum of the estimated
undiscounted cash flows attributable to the assets in question is less than
their carrying value. If less, we recognize an impairment loss based on
the excess of the carrying amount of the assets over their respective fair
values. Fair value is determined by discounted future cash flows,
appraisals or other methods. If the assets determined to be impaired are
to be held and used, we recognize an impairment loss through a charge to
our
operating results to the extent the present value of anticipated net cash
flows
attributable to the asset are less than the asset’s carrying value, which we
depreciate over the remaining estimated useful life of the asset. We may
incur
impairment losses, or additional losses on already impaired assets, in future
periods if factors influencing our estimates change.
Litigation
Our
current estimated range of liability related to pending litigation is based
on
the probable loss of claims for which we can estimate the amount and range
of
loss. Recorded reserves were immaterial at March 31, 2007.
Because
of the uncertainties related to both the probability of loss and the amount
and
range of loss on our pending litigation, we are unable to make a reasonable
estimate of the liability that could result from an unfavorable outcome.
As additional information becomes available, we will assess the potential
liability related to our pending litigation and revise our estimates.
Revisions in our estimates of the potential liability could materially impact
our results of operation and financial position.
26
Results
of Operations
The
following table sets forth certain operational data as a percentage of net
sales
for the years indicated:
|
Year
Ended March 31,
|
||||||||||||
|
2007
|
2006
|
2005
|
||||||||||
|
Net
sales
|
100.0 | % | 100.0 | % | 100.0 | % | ||||||
|
Cost
of sales
|
39.9 | % | 40.6 | % | 42.9 | % | ||||||
|
Gross
profit
|
60.1 | % | 59.4 | % | 57.1 | % | ||||||
|
Research
and development
|
10.9 | % | 10.2 | % | 11.0 | % | ||||||
|
Selling,
general and administrative
|
15.7 | % | 14.0 | % | 13.1 | % | ||||||
|
Special
charges
|
--- | % | --- | % | 2.5 | % | ||||||
|
Operating
income
|
33.5 | % | 35.2 | % | 30.5 | % | ||||||
Net
Sales
We
operate in one industry segment and engage primarily in the design, development,
manufacture and marketing of semiconductor products. We sell our
products to distributors and original equipment manufacturers, referred to
as
OEMs, in a broad range of market segments, perform ongoing credit evaluations
of
our customers and generally require no collateral.
Our
net
sales of $1,039.7 million in fiscal 2007 increased by $111.8 million, or
10.8%,
over fiscal 2006, and net sales of $927.9 million in fiscal 2006 increased
by
$81.0 million, or 9.6%, over fiscal 2005. The increases in net sales
in fiscal 2007 compared to fiscal 2006 and in fiscal 2006 compared to fiscal
2005 resulted primarily from increased demand, predominantly for our proprietary
microcontroller and analog products. Average selling prices for our
products were flat in fiscal 2007 over fiscal 2006 and down approximately
4% in
fiscal 2006 over fiscal 2005. The number of units of our products
sold was up approximately 12% in fiscal 2007 over fiscal 2006 and approximately
14% in fiscal 2006 over fiscal 2005. The average selling prices and
the unit volumes of our sales are impacted by the mix of our products sold
and
overall semiconductor market conditions. We believe that we have
continued to grow our percentage of market share in the embedded control
market
over the last three fiscal years. Key factors in achieving the amount
of net sales during the last three fiscal years include:
|
|
·
|
continued
market share gains;
|
|
|
·
|
increasing
semiconductor content in our customers’
products;
|
|
|
·
|
customers’
increasing needs for the flexibility offered by our programmable
solutions;
|
|
|
·
|
our
new product offerings that have increased our served available
market;
|
|
|
·
|
increasing
demand for our products;
|
|
|
·
|
economic
conditions in the markets we serve;
and
|
|
|
·
|
inventory
holding patterns of our customers.
|
We
recognize revenue from product sales upon shipment to OEMs. Under our
shipping terms, legal title generally passes to the customer upon shipment
from
Microchip. We have no post shipment
obligations. Distributors worldwide generally have broad rights to
return products and price protection rights, so we defer revenue recognition
until the distributors sell the product to their customers. Upon
shipment, amounts billed to distributors are included in accounts receivable,
inventory is relieved, the sale is deferred and the gross margin is reflected
as
a current liability until the product is sold by the distributors to their
customers.
Sales
by
product line for the fiscal years ended March 31, 2007, 2006 and 2005 were
as
follows (dollars in thousands):
|
Year
Ended March 31,
|
||||||||||||||||||||||||
|
2007
|
|
2006
|
2005
|
|||||||||||||||||||||
|
Microcontrollers
|
$ |
834,293
|
80.2 | % | $ |
736,179
|
79.3 | % | $ |
674,902
|
79.7 | % | ||||||||||||
|
Memory
products
|
122,748
|
11.8
|
125,335
|
13.5
|
115,120
|
13.6
|
||||||||||||||||||
|
Analog
and interface products
|
82,630
|
8.0
|
66,379
|
7.2
|
56,914
|
6.7
|
||||||||||||||||||
|
Total
Sales
|
$ |
1,039,671
|
100.0 | % | $ |
927,893
|
100.0 | % | $ |
846,936
|
100.0 | % | ||||||||||||
Microcontrollers
Our
microcontroller product line represents the largest component of our total
net
sales. Microcontrollers and associated application development
systems accounted for approximately 80.2% of our total net sales in fiscal
2007,
approximately 79.3% of our total net sales in fiscal 2006 and approximately
79.7% of our total net sales in fiscal 2005.
27
Net
sales
of our microcontroller products increased approximately 13.3% in fiscal 2007
compared to fiscal 2006, and increased approximately 9.1% in fiscal 2006
compared to fiscal 2005. The increases in net sales were primarily
due to increased demand for our microcontroller products in end markets,
driven
principally by market share gains and those factors described above under
“Net
Sales” at page 27. The end markets that we serve include the
consumer, automotive, industrial control, communications and computing control
markets.
Historically,
average selling prices in the semiconductor industry decrease over the life
of
any particular product. The overall average selling prices of our
microcontroller products have remained relatively constant over time due
to the
proprietary nature of these products. We have experienced, and expect
to continue to experience, moderate pricing pressure in certain microcontroller
product lines, primarily due to competitive conditions. We have in
the past been able to, and expect in the future to be able to, moderate average
selling price declines in our microcontroller product lines by introducing
new
products with more features and higher prices. We may be unable to
maintain average selling prices for our microcontroller products as a result
of
increased pricing pressure in the future, which could adversely affect our
operating results.
Memory
Products
Sales
of
our memory products accounted for approximately 11.8% of our total net sales
in
fiscal 2007, approximately 13.5% of our total net sales in fiscal 2006 and
approximately 13.6% of our total net sales in fiscal 2005.
Net
sales
of our memory products decreased approximately 2.1% in fiscal 2007 compared
to
fiscal 2006, and increased approximately 8.9% in fiscal 2006 compared to
fiscal
2005, driven primarily by customer demand conditions within the Serial EEPROM
market, which products comprise substantially all of our memory product net
sales.
Serial
EEPROM product pricing has historically been cyclical in nature, with steep
price declines followed by periods of relative price stability, driven by
changes in industry capacity at different stages of the business
cycle. We have experienced, and expect to continue to experience,
varying degrees of competitive pricing pressures in our Serial EEPROM
products. We may be unable to maintain the average selling prices of
our Serial EEPROM products as a result of increased pricing pressure in the
future, which could adversely affect our operating results.
Analog
and Interface Products
Sales
of
our analog and interface products accounted for approximately 8.0% of our
total
net sales in fiscal 2007, 7.2% of our total net sales in fiscal 2006 and
approximately 6.7% of our total net sales in fiscal 2005.
Net
sales
of our analog and interface products increased approximately 24.5% in fiscal
2007 compared to fiscal 2006 and increased approximately 16.6% in fiscal
2006
compared to fiscal 2005. The increase in net sales of our analog and
interface products in these periods were driven primarily by market share
gains
and supply and demand conditions within the analog and interface
market.
Analog
and interface products can be proprietary or non-proprietary in
nature. Currently, we consider more than half of our analog and
interface product mix to be proprietary in nature, where prices are relatively
stable, similar to the pricing stability experienced in our microcontroller
products. The non-proprietary portion of our analog and interface
business will experience price fluctuations, driven primarily by the current
supply and demand for those products. We may be unable to maintain
the average selling prices of our analog and interface products as a result
of
increased pricing pressure in the future, which could adversely affect our
operating results. We anticipate the proprietary portion of our
analog and interface products will increase over time.
Distribution
Distributors
accounted for 65% of our net sales in fiscal 2007, 2006 and 2005.
Our
largest distributor accounted for approximately 11% of our net sales in fiscal
2007, approximately 13% of our net sales in fiscal 2006 and fiscal
2005. Our two largest distributors together accounted for 21% of our
net sales in fiscal 2007, 24% of our net sales in fiscal 2006 and 25% of
our net
sales in 2005.
Generally,
we do not have long-term agreements with our distributors and we, or our
distributors, may terminate their relationships with us with little or no
advanced notice. The loss of, or the disruption in the operations of,
one or more of our distributors could reduce our future net sales in a given
quarter and could result in an increase in inventory returns.
At
March
31, 2007, distributors were maintaining an average of approximately 1.8 months
of inventory of our products calculated based on the prior three months of
their sell through activity. Over the past three fiscal years, the
months of inventory maintained by our distributors have fluctuated between
approximately 1.8 months and 2.5 months. Thus, inventory levels at
our distributors are at the low end of the range we have experienced over
the
last three years. We do not believe that
28
Distributors
generally have broad-based rights to return product to us. As revenue
on distributor shipments is not recognized until the distributors sell our
product on to their end customers, distributor returns have no impact on
our
revenue recognition.
We
also
grant certain credits to our distributors and also offer these distributors
price protection. The credits are granted to the distributors on
specifically identified pieces of the distributors’ business to allow them to
earn a competitive gross margin on the sale of our products to their end
customers. The credits are on a per unit basis and are not given to
the distributor until they provide information regarding the sale to their
end
customer. The effect of granting these credits establishes the net
selling price from us to our distributors for the products and results in
the
net revenue recognized by us when the product is sold by the distributors
to
their end customers.
We
reduce
product pricing through price protection based on market conditions, competitive
considerations and other factors. Price protection is granted to
distributors on the inventory that they have on hand at the date the price
protection is offered. When we reduce the selling price of our
products, it allows the distributors to claim a credit against its outstanding
accounts receivables balances based on the new price of the inventory it
has on
hand as of the date of the price reduction. There is no revenue
recognition impact from the price protection.
We
do not
offer material incentive programs to our distributors.
Sales
by Geography
Sales
by
geography for the fiscal years ended March 31, 2007, 2006 and 2005 were as
follows (dollars in thousands):
|
Year
Ended March 31,
|
||||||||||||||||||||||||
|
2007
|
|
2006
|
2005
|
|
||||||||||||||||||||
|
Americas
|
$ |
287,371
|
27.6
|
% | $ |
266,353
|
28.7
|
% | $ |
248,881
|
29.4
|
% | ||||||||||||
|
Europe
|
302,708
|
29.1
|
255,367
|
27.5
|
232,493
|
27.4
|
||||||||||||||||||
|
Asia
|
449,592
|
43.3
|
406,173
|
43.8
|
365,562
|
43.2
|
||||||||||||||||||
|
Total
Sales
|
$ |
1,039,671
|
100.0 | % | $ |
927,893
|
100.0 | % | $ |
846,936
|
100.0 | % | ||||||||||||
Our
sales to foreign
customers have been predominately in Asia and Europe, which we attribute
to the
manufacturing strength in those areas for automotive, communications, computing,
consumer and industrial control products. Americas sales include
sales to customers in the United States, Canada, Central America and South
America.
Sales
to
foreign customers accounted for approximately 74% of our net sales in fiscal
2007, 74% of our net sales in fiscal 2006 and 73% of our net sales in fiscal
2005. Substantially all of our foreign sales are U.S. dollar
denominated.
Sales
to
customers in China, including Hong Kong, accounted for approximately 18%
of our
net sales in fiscal 2007 and approximately 17% of our net sales in fiscal
2006
and 2005. Sales to customers in Taiwan accounted for approximately
10% of our net sales in fiscal 2007, 2006 and 2005. We did not have
sales into any other countries that exceeded 10% of our net sales during
the
last three fiscal years.
Gross
Profit
Our
gross
profit was $624.8 million in fiscal 2007, $550.9 million in fiscal 2006 and
$484.0 million in fiscal 2005. Gross profit as a percent of sales was
60.1% in fiscal 2007, 59.4% in fiscal 2006 and 57.1% in fiscal
2005.
The
most
significant factors affecting our gross profit percentage over the past three
fiscal years were:
|
|
·
|
increased
cost of sales of $3.3 million in fiscal 2007 associated with share-based
compensation expense under SFAS No.
123R.
|
|
|
·
|
fluctuations
in the product mix of microcontrollers, proprietary and non-proprietary
analog products and Serial EEPROM products resulting in higher
average
selling prices for our products.
|
|
|
·
|
continual
cost reductions in wafer fabrication and assembly and test manufacturing
such as new manufacturing technologies and more efficient manufacturing
techniques.
|
29
Other
factors that impacted our gross profit percentage in the periods covered
by this
report include:
|
|
·
|
changes
in capacity utilization and absorption of fixed
costs,
|
|
|
·
|
gross
profit on products sold through the distribution
channel,
|
|
|
·
|
depreciation
expense as a percentage of cost of sales,
and
|
|
|
·
|
inventory
write-offs and the sale of inventory that was previously written
off.
|
During
fiscal 2007, we operated at approximately 99% of our Fab 2
capacity. During fiscal 2006, we operated at approximately 98% of our
Fab 2 capacity. Our utilization of Fab 4’s total capacity is at
relatively low levels although we are utilizing all of the installed equipment
base. We expect to maintain the current level of capacity utilization
at Fab 2 during the first quarter of fiscal 2008 and to modestly increase
the
current level of capacity utilization at Fab 4 during the first quarter of
fiscal 2008.
The
process technologies utilized impact our gross margins. Fab 2
currently utilizes various manufacturing process technologies, but predominantly
utilizes our 0.5 to 1.0 micron processes. At March 31, 2007, Fab 4
predominantly utilized our 0.5 micron process technology. We continue
to transition products to more advanced process technologies to reduce future
manufacturing costs. All of our production has been on 8-inch wafers
during the periods covered by this report.
Our
overall inventory levels were $121.0 million at March 31, 2007, compared
to
$115.0 million at March 31, 2006 and $103.7 million at March 31,
2005. We maintained 107 days of inventory on our balance sheet at
March 31, 2007 compared to 106 days of inventory at March 31, 2006 and 107
days
at March 31, 2005.
We
anticipate that our gross margins will fluctuate over time, driven primarily
by
the overall product mix of microcontroller, analog and interface and memory
products and the percentage of net sales of each of these products in a
particular quarter, as well as manufacturing yields, fixed cost absorption,
capacity utilization levels, particularly those at Fab 4, and competitive
and economic conditions.
At
March
31, 2007, approximately 72% of our assembly requirements were performed in
our
Thailand facility, compared to approximately 66% as of March 31, 2006 and
approximately 70% at March 31, 2005. Contractors located in Asia
perform the balance of our assembly operations. Substantially all of
our test requirements were performed in our Thailand facility over the last
three fiscal years. We believe that the assembly and test operations
performed at our Thailand facility provide us with significant cost savings
when
compared to contractor assembly and test costs, as well as increased control
over these portions of the manufacturing process.
We
rely
on outside wafer foundries for a small portion of our wafer fabrication
requirements.
Our
use
of third parties involves some reduction in our level of control over the
portions of our business that we subcontract. While we review the
quality, delivery and cost performance of our third party contractors, our
future operating results could suffer if any third party contractor is unable
to
maintain manufacturing yields, assembly and test yields and costs at
approximately their current levels.
Research
and Development (R&D)
R&D
expenses for fiscal 2007 were $113.7 million, or 10.9% of sales, compared
to
$94.9 million, or 10.2% of sales, for fiscal 2006 and $93.0 million, or 11.0%
of
sales, for fiscal 2005. We are committed to investing in new and
enhanced products, including development systems software, and in our design
and
manufacturing process technologies. We believe these investments are
significant factors in maintaining our competitive position. We
expense all R&D costs as incurred. R&D expenses include
labor, depreciation, masks, prototype wafers, and expenses for the development
of process technologies, new packages, and software to support new products
and
design environments.
R&D
expenses increased $18.8 million, or 19.8%, for fiscal 2007 over fiscal
2006. The primary reasons for the dollar increase in R&D costs in
fiscal 2007 compared to fiscal 2006 was higher labor costs as a result of
expanding our internal R&D headcount, increases in bonuses and $9.6 million
of share-based compensation as a result of the adoption of SFAS
No. 123R. R&D expenses increased $1.9 million, or 2.0%, for
fiscal 2006 over fiscal 2005. The primary reasons for the dollar
increase in R&D costs in fiscal 2006 compared to fiscal 2005 were higher
labor and recruitment costs as a result of expanding our technical resources
and
increases in bonuses.
Selling,
General and Administrative
Selling,
general and administrative expenses for fiscal 2007 were
$163.2 million, or 15.7% of sales, compared to
$129.6 million, or 14.0% of sales, for fiscal 2006, and
$111.2 million, or 13.1% of sales, for fiscal 2005. Selling,
general and
30
Selling,
general and administrative expenses increased
$33.7 million, or 26.0%, for fiscal 2007 over fiscal
2006. The primary reasons for the dollar increases in selling,
general and administrative expenses in fiscal 2007 over fiscal 2006 were
higher
labor costs as a result of expanding our internal resources involved in the
technical aspects of selling our products, increases in bonuses and
$14.5 million of share-based compensation as a result of the adoption of
SFAS No. 123R. Selling, general and administrative expenses increased
$18.4 million, or 16.5%, for fiscal 2006 over fiscal 2005. The
primary reasons for the dollar increase in selling, general and administrative
expenses in fiscal 2006 over fiscal 2005 were higher labor costs as a result
of
expanding our internal resources, increases in bonuses and increases in travel
expenses.
Selling,
general and administrative expenses fluctuate over time, primarily due to
revenue and operating expense investment levels.
Special
Charges
In
fiscal
2005, we reached an agreement with U.S. Philips Corporation and Philips
Electronics North America Corp. (together “Philips”) regarding patent license
litigation between Philips and ourselves. The agreement included
dismissal of the then pending litigation and the cross-license of certain
patents between Philips and Microchip. We recorded a special charge
of $21.1 million in the quarter ended June 30, 2004 associated with this
matter. As part of the settlement, we licensed certain of our patents
related to 8-pin microcontrollers to Philips, and Philips licensed its patents
related to I2C
serial communications to us, each on fully-paid up, non-royalty bearing
worldwide licenses. The definitive agreement related to this matter
was finalized and executed, and we made a cash payment to Philips during
our
fiscal quarter ending September 30, 2004.
There
were no special charges in fiscal 2007 or 2006.
Other
Income (Expense)
Interest
income in fiscal 2007 increased from interest income in fiscal 2006 as our
average invested balances were at higher levels in fiscal 2007 compared to
fiscal 2006, and we earned a higher interest rate on our invested
balances. Interest income in fiscal 2006 increased from interest
income in fiscal 2005 as our average invested balances were at higher levels
in
fiscal 2006 compared to fiscal 2005, and we earned a higher interest rate
on our
invested balances.
Provision
for Income Taxes
Provisions
for income taxes reflect tax on our foreign earnings and federal and state
tax
on our U.S. earnings. Our effective tax rate was 11.0% in fiscal
2007, 32.5% in fiscal 2006 and 22.9% in fiscal 2005, and is lower than statutory
rates in the United States due primarily to lower tax rates at our foreign
locations, R&D tax credits and export sales incentives. Our
effective tax rate in fiscal 2007 reflects a $52.2 million benefit related
to a tax settlement for our fiscal 1999 through fiscal 2001 tax years that
occurred in the fourth quarter of fiscal 2007 which decreased our effective
tax
rate for fiscal 2007 by 13.0%. Our effective tax rate in fiscal 2006
reflects a $30.6 million tax expense related to the repatriation of $500
million
of foreign earnings under the American Jobs Creation Act (the “Jobs Act”) that
was effective for the third quarter of fiscal 2006 which increased our effective
tax rate in fiscal 2006 by 8.5%. We expect our effective tax rate for
fiscal 2008 to be approximately 20%.
Various
taxing authorities in the United States and other countries in which we do
business are increasing their scrutiny of the tax structures employed by
businesses. Companies of our size and complexity are regularly
audited by the taxing authorities in the jurisdictions in which they conduct
significant operations. We are currently under audit by the IRS for
our fiscal years ended March 31, 2002, 2003 and 2004. We recognize
liabilities for anticipated tax audit issues in the United States and other
tax
jurisdictions based on our estimate of whether, and the extent to which,
additional tax payments are probable. We believe that we maintain
adequate tax reserves to offset any potential tax liabilities that may arise
upon these and other pending audits in the United States and other countries
in
which we do business. If such amounts ultimately prove to be
unnecessary, the resulting reversal of such reserves would result in tax
benefits being recorded in the period the reserves are no longer deemed
necessary. If such amounts ultimately prove to be less than any final
assessment, a future charge to expense would be recorded in the period in
which
the assessment is determined.
Our
Thailand manufacturing operations currently benefit from numerous tax holidays
that have been granted to us by the Thailand government based on our investments
in property, plant and equipment in Thailand. Our tax holiday periods
in Thailand expire at various times in the future. One of our
Thailand tax holidays expired in September 2006 and the
31
Liquidity
and Capital Resources
We
had
$1,278.4 million in cash, cash equivalents and short-term and long-term
investments at March 31, 2007, a decrease of $6.7 million from the March
31,
2006 balance. The decrease in cash, cash equivalents and short-term and
long-term investments over this time period is primarily attributable to
a
$269.0 million pay down of short-term debt offset by cash generated from
operating activities.
Net
cash
provided from operating activities was $429.8 million for fiscal 2007, $437.3
million for fiscal 2006 and $352.7 million for fiscal 2005. The increase
in cash
flow from operations was primarily due to increases in net income and changes
in
accounts payable and accrued liabilities. Accrued income taxes
reduced by $60.4 million and accounts payable reduced by $16.2 million in
fiscal 2007.
Net
cash
used in investing activities was $442.2 million for fiscal 2007,
$136.6 million for fiscal 2006 and $370.7 million in fiscal
2005. The increase in cash used in investing activities in fiscal
2007 over fiscal 2006 was primarily due to changes in our net purchases,
sales
and maturities of investments. The increase in cash used in investing
activities in fiscal 2006 over fiscal 2005 was primarily due to changes in
our
net purchases, sales and maturities of investments.
Our
level
of capital expenditures varies from time to time as a result of actual and
anticipated business conditions. Capital expenditures were
$60.0 million in fiscal 2007, $76.3 million in fiscal 2006 and $63.2
million in fiscal 2005. The primary reason for the dollar differences
in capital expenditures in the periods covered by this report related to
requirements for funding capital expansion activities in our manufacturing
operations. We currently intend to spend approximately $80 million
during the next 12 months to invest in equipment and facilities to maintain,
and
selectively increase, capacity to meet our currently anticipated
needs.
We
expect
to finance capital expenditures through our existing cash balances and cash
flows from operations. We believe that the capital expenditures
anticipated to be incurred over the next 12 months will provide sufficient
manufacturing capacity to meet our currently anticipated needs.
Net
cash
used in financing activities was $385.3 million for fiscal 2007. Net
cash provided by financing activities was $195.8 million
for fiscal 2006. Net cash used in financing activities was
$18.6 million for fiscal 2005. Proceeds from the sale of stock,
the exercise of stock options and employee purchases under our employee stock
purchase plan were $68.7million
for fiscal 2007, $95.8 million for fiscal 2006 and $47.2 million for fiscal
2005. Cash expended for the repurchase of our common stock was $0 in
fiscal 2007, $3.3 million in fiscal 2006 and $68.3 million in fiscal
2005. We had short-term borrowings of $0 at March 31, 2007, $269.0
million at March 31, 2006 and $45.5 million at March 31, 2005. The
short-term borrowings of $269.0 million at March 31, 2006 relate to transactions
associated with the repatriation of foreign earnings under the Jobs
Act. During fiscal 2007, we paid down $269.0 million in
short-term borrowings. During fiscal 2006, we paid down $45.5 million
in short-term borrowings and initiated new borrowings of $269.0
million. To complete the repatriation of $500 million in fiscal 2006,
we initiated the $269.0 million in borrowings, which were collateralized
against
investments that were held in the foreign locations, allowing the investments
to
reach their normal maturity date. The short-term debt was a result of
repurchase agreements that were in place with two investment
firms. Effective with the adoption of SFAS No. 123R on April 1,
2006, we began reporting the excess tax benefit from share-based payment
arrangements as a cash flow from financing activities rather than a cash
flow
from operating activities. The excess tax benefit from share-based
payment arrangements was $22.8 million in fiscal 2007.
On
April
22, 2004, our Board of Directors authorized the repurchase of up to 2,500,000
shares of our common stock in the open market or in privately negotiated
transactions. As of March 31, 2007, we had repurchased 1,004,834
common shares under this authorization for a total of $26.6
million. On October 25, 2006, our Board of Directors authorized the
repurchase of up to an additional 10,000,000 shares of our common stock in
the
open market or in privately negotiated transactions. As of March 31,
2007, no shares had been purchased under this authorization. As of
March 31, 2007, all of the purchased shares under our authorized repurchase
programs had been reissued to fund stock option exercises and purchases under
our employee stock purchase plan. The timing and amount of any future
repurchases will depend upon market conditions and corporate
considerations.
On
October 28, 2002, we announced that our Board of Directors had approved and
instituted a quarterly cash dividend on our common stock. The initial
quarterly dividend of $0.02 per share was paid on December 6, 2003 in the
amount
of $4.0 million. We have continued to pay quarterly dividends
and have increased the amount of such dividends on a regular
basis. During fiscal 2005, we paid dividends in the amount of $0.208
per share for a total dividend payment of $43.0 million. During
fiscal 2006, we paid dividends in the amount of $0.57 per share for a total
dividend payment of $120.1 million. During fiscal 2007, we paid
dividends in the amount of $0.965 per share for a total dividend payment of
$207.9 million. On
32
We
enter
into hedging transactions from time to time in an attempt to reduce our exposure
to currency rate fluctuations. Although none of the countries in
which we conduct significant foreign operations have had a highly inflationary
economy in the last five years, there is no assurance that inflation rates
or
fluctuations in foreign currency rates in countries where we conduct operations
will not adversely affect our operating results in the future. We had
no hedging transactions outstanding at March 31, 2007.
We
believe that our existing sources of liquidity combined with cash generated
from
operations will be sufficient to meet our currently anticipated cash
requirements for at least the next 12 months. However, the
semiconductor industry is capital intensive. In order to remain
competitive, we must constantly evaluate the need to make significant
investments in capital equipment for both production and research and
development. We may seek additional equity or debt financing from
time to time to maintain or expand our wafer fabrication and product assembly
and test facilities, or for other purposes. The timing and amount of
any such financing requirements will depend on a number of factors, including
demand for our products, changes in industry conditions, product mix, and
competitive factors. There can be no assurance that such financing
will be available on acceptable terms, and any additional equity financing
would
result in incremental ownership dilution to our existing
stockholders.
Contractual
Obligations
The
following table summarizes our significant contractual obligations at March
31,
2007, and the effect such obligations are expected to have on our liquidity
and
cash flows in future periods. This table excludes amounts already
recorded on our balance sheet as current liabilities at March 31, 2007 (dollars
in thousands):
|
Payments
Due by Period
|
||||||||||||||||||||
|
Total
|
Less
than 1
year
|
1
–
3 years
|
3
–
5 years
|
More
than 5
years
|
||||||||||||||||
|
Operating
lease obligations
|
$ |
11,577
|
$ |
3,956
|
$ |
5,127
|
$ |
2,494
|
$ |
---
|
||||||||||
|
Capital
purchase obligations (1)
|
20,736
|
20,736
|
---
|
---
|
---
|
|||||||||||||||
|
Other
purchase obligations and commitments (2)
|
1,754
|
1,140
|
614
|
---
|
---
|
|||||||||||||||
|
Long-term
debt obligations
|
---
|
---
|
---
|
---
|
---
|
|||||||||||||||
|
Total
contractual obligations (3)
|
$ |
34,067
|
$ |
25,832
|
$ |
5,741
|
$ |
2,494
|
$ |
---
|
||||||||||
|
|
(1)
Capital
purchase obligations represent commitments for construction or
purchases
of property, plant and equipment. They are not recorded as
liabilities on our balance sheet as of March 31, 2007, as we have
not yet
received the related goods or taken title to the
property.
|
|
|
(2)
Other
purchase obligations and commitments include payments due under
various
types of licenses.
|
|
|
(3)
Total
contractual obligations do not include contractual obligations
recorded on
the balance sheet as current liabilities, or certain purchase obligations
as discussed below.
|
Purchase
orders or contracts for the purchase of raw materials and other goods and
services are not included in the table above. We are not able to
determine the aggregate amount of such purchase orders that represent
contractual obligations, as purchase orders may represent authorizations
to
purchase rather than binding agreements. For the purpose of this
table, contractual obligations for purchase of goods or services are defined
as
agreements that are enforceable and legally binding on Microchip and that
specify all significant terms, including: fixed or minimum quantities to
be
purchased; fixed, minimum or variable price provisions; and the approximate
timing of the transaction. Our purchase orders are based on our
current manufacturing needs and are fulfilled by our vendors with short time
horizons. We do not have significant agreements for the purchase of
raw materials or other goods specifying minimum quantities or set prices
that
exceed our expected requirements for three months. We also enter into
contracts for outsourced services; however, the obligations under these
contracts were not significant and the contracts generally contain clauses
allowing for cancellation without significant penalty.
33
The
expected timing of payment of the obligations discussed above is estimated
based
on current information. Timing of payments and actual amounts paid
may be different depending on the time of receipt of goods or services or
changes to agreed-upon amounts for some obligations.
Off-Balance
Sheet Arrangements
As
of
March 31, 2007, we are not involved in any off-balance sheet arrangements,
as
defined in Item 3(a)(4)(ii) of SEC Regulation S-K.
Recently
Issued Accounting Pronouncements
In
June
2006, the Financial Accounting Standards Board (FASB) issued Financial
Interpretation No. (FIN) 48, Accounting for Uncertainty in Income Taxes,
which
clarifies the accounting for uncertainty in income taxes recognized in an
enterprise’s financial statements in accordance with FASB Statement No. 109,
Accounting for Income Taxes. The interpretation prescribes a recognition
threshold and measurement attribute for the financial statement recognition
and
measurement of a tax position taken or expected to be taken in a tax return.
FIN
48 is effective for fiscal years beginning after December 15, 2006. We are
reviewing our tax positions taken to determine the effect, if any, that the
adoption of this Interpretation will have on our results of operations or
financial condition.
In
September 2006, the FASB issued SFAS No. 157, Fair Value Measurement (SFAS
No.
157). SFAS No. 157 defines fair value, establishes a framework for measuring
fair value in generally accepted accounting principles, and expands disclosures
about fair value measurements, but does not require any new fair value
measurement. SFAS No. 157 is effective for fiscal years beginning after November
15, 2007 and interim periods within those fiscal years. We are in the process
of
determining the effect, if any, that the adoption of SFAS No. 157 will have
on
our consolidated financial statements. Because Statement No. 157 does not
require any new fair value measurements or re-measurements of previously
computed fair values, we do not believe the adoption of this Statement will
have
a material effect on our results of operations or financial
condition.
On
February 15, 2007, the FASB
issued SFAS No. 159, The Fair Value Option for Financial Assets and Financial
Liabilities (SFAS No. 159). Under this Standard, we may elect to report
financial instruments and certain other items at fair value on a
contract-by-contract basis with changes in value reported in earnings. This
election is irrevocable. SFAS No. 159 provides an opportunity to mitigate
volatility in reported earnings that is caused by measuring hedged assets
and
liabilities that were previously required to use a different accounting method
than the related hedging contracts when the complex provisions of SFAS No.
133
hedge accounting are not met. SFAS No. 159 is effective for years beginning
after November 15, 2007. Early adoption within 120 days of the beginning
of our
2008 fiscal year is permissible, provided we have not yet issued interim
financial statement for 2008 and have adopted SFAS No. 157. We are currently
evaluating the potential impact of adopting this Standard.
Item
7A. QUANTITATIVE
AND QUALITATIVE DISCLOSURES ABOUT MARKET RISK
Our
investment portfolio, consisting of fixed income securities and money market
funds that we hold on an available-for-sale basis, was $1,278.4 million as
of March 31, 2007, and $1,285.1 million as of March 31, 2006. These
securities, like all fixed income instruments, are subject to interest rate
risk
and will decline in value if market interest rates increase. We have
the ability to hold our fixed income investments until maturity and, therefore,
we would not expect to recognize any material adverse impact in income or
cash
flows if market interest rates increase. The following table provides
information about our available-for-sale securities that are sensitive to
changes in interest rates. We have aggregated our available-for-sale
securities for presentation purposes since they are all very similar in nature
(dollars in thousands):
|
Financial
instruments mature during the fiscal year ended March 31,
|
||||||||||||||||||||||||
|
2008
|
2009
|
2010
|
2011
|
2012
|
Thereafter
|
|||||||||||||||||||
|
Available-for-sale
securities
|
$ |
291,592
|
$ |
244,198
|
$ |
319,997
|
$ |
45,674
|
$ |
---
|
$ |
209,449
|
||||||||||||
|
Weighted-average
yield rate
|
4.19 | % | 4.11 | % | 4.66 | % | 5.69 | % |
---
|
5.21 | % | |||||||||||||
We
have
international operations and are thus subject to foreign currency rate
fluctuations. To date, our exposure related to exchange rate
volatility has not been significant. Approximately 99% of our sales
are denominated in U.S. dollars. We maintain hedges related to our
foreign currency exposure of our net investment in a foreign operation as
needed. There were no hedges outstanding as of March 31, 2007 or
March 31, 2005. The amount of the hedges outstanding as of March 31,
2006 was immaterial. If foreign currency rates fluctuate by 15% from
the rates at March 31, 2007 and 2006, the effect on our financial position
and
results of operation would be immaterial.
34
During
the normal course of business we are routinely subjected to a variety of
market
risks, examples of which include, but are not limited to, interest rate
movements and foreign currency fluctuations, as we discuss in this Item 7A,
and
collectability of accounts receivable. We continuously assess these
risks and have established policies and procedures to protect against the
adverse effects of these and other potential exposures. Although we
do not anticipate any material losses in these risk areas, no assurance can
be
made that material losses will not be incurred in these areas in the
future.
|
Item
8.
|
FINANCIAL
STATEMENTS AND SUPPLEMENTARY
DATA
|
The
Consolidated Financial Statements listed in the index appearing under Item
15(a)(1) hereof are filed as part of this Form 10-K. See also Index
to Financial Statements, below.
|
Item
9.
|
CHANGES
IN AND DISAGREEMENTS WITH ACCOUNTANTS ON ACCOUNTING
AND
|
|
|
FINANCIAL
DISCLOSURE
|
None.
|
Item
9A.
|
CONTROLS
AND PROCEDURES
|
Evaluation
of Disclosure Controls and Procedures.
As
of the
end of the period covered by this Annual Report on Form 10-K, as required
by
paragraph (b) of Rule 13a-15 or Rule 15d-15 under the Securities Exchange
Act of
1934, as amended, we evaluated under the supervision of our Chief Executive
Officer and our Chief Financial Officer, the effectiveness of our disclosure
controls and procedures (as defined in Rules 13a-15(e) or 15d-15(e) of the
Securities Exchange Act of 1934, as amended). Based on this evaluation, our
Chief Executive Officer and
our
Chief Financial Officer have concluded that our disclosure controls and
procedures are effective to ensure that information we are required to disclose
in reports that we file or submit under the Securities Exchange Act of 1934
(i)
is recorded, processed, summarized and reported within the time periods
specified in Securities and Exchange Commission rules and forms, and (ii)
is
accumulated and communicated to our management, including our Chief Executive
Officer
and our Chief Financial
Officer, as appropriate to allow timely decisions regarding required disclosure.
Our disclosure controls and procedures are designed to provide reasonable
assurance that such information is accumulated and communicated to our
management. Our disclosure controls and procedures include components of
our
internal control over financial reporting. Management’s assessment of the
effectiveness of our internal control over financial reporting is expressed
at
the level of reasonable assurance because a control system, no matter how
well
designed and operated, can provide only reasonable, but not absolute, assurance
that the control system’s objectives will be met.
Management
Report on Internal Control Over Financial Reporting
Our
management is responsible for establishing and maintaining adequate internal
control over financial reporting to provide reasonable assurance regarding
the
reliability of our financial reporting and the preparation of financial
statements for external purposes in accordance with generally accepted
accounting principles. Internal control over financial reporting
includes those policies and procedures that (i) pertain to the maintenance
of
records that in reasonable detail accurately and fairly reflect the transactions
and dispositions of the assets of the company; (ii) provide reasonable assurance
that transactions are recorded as necessary to permit preparation of financial
statements in accordance with generally accepted accounting principles, and
that
receipts and expenditures of the Company are being made only in accordance
with
authorizations of management and directors of the Company; and (iii) provide
reasonable assurance regarding prevention or timely detection of unauthorized
acquisition, use or disposition of the Company’s assets that could have a
material effect on our financial statements.
Management
assessed our internal control over financial reporting as of March 31, 2007,
the
end of our fiscal year. Management based its assessment on criteria
established in Internal Control – Integrated Framework issued by the
Committee of Sponsoring Organizations of the Treadway
Commission. Management’s assessment included evaluation of such
elements as the design and operating effectiveness of key financial reporting
controls, process documentation, accounting policies, and our overall control
environment. This assessment is supported by testing and monitoring
performed by our finance organization.
Based
on
our assessment, management has concluded that our internal control over
financial reporting was effective as of the end of the fiscal year to provide
reasonable assurance regarding the reliability of financial reporting and
the
preparation of financial statements for external reporting purposes in
accordance with generally accepted accounting principles. We reviewed
the results of management’s assessment with the Audit Committee of our Board of
Directors.
35
Our
independent registered public accounting firm, Ernst & Young LLP, who also
audited our consolidated financial statements, audited management’s assessment
and independently assessed the effectiveness of our internal control over
financial reporting. Ernst & Young LLP has issued their
attestation report, which is included in Part II, Item 9A of this Form
10-K.
Changes
in Internal Control over Financial Reporting.
During
the three months ended March 31, 2007, there was no change in our internal
control over financial reporting identified in connection with the evaluation
required by paragraph (d) of Rule 13a-15 or Rule 15d-15 that has materially
affected, or is reasonably likely to materially affect, our internal control
over financial reporting.
[Remainder
of page intentionally left blank.]
36
REPORT
OF INDEPENDENT REGISTERED PUBLIC ACCOUNTING FIRM
The
Board of Directors and Stockholders of
Microchip
Technology Incorporated and subsidiaries
We
have
audited management’s assessment, included in the accompanying Management Report
on Internal Control Over Financial Reporting, that Microchip Technology
Incorporated and subsidiaries maintained effective internal control over
financial reporting as of March 31, 2007, based on criteria established in
Internal Control—Integrated Framework issued by the Committee of Sponsoring
Organizations of the Treadway Commission (the COSO criteria). Microchip
Technology Incorporated’s management is responsible for maintaining effective
internal control over financial reporting and for its assessment of the
effectiveness of internal control over financial reporting. Our responsibility
is to express an opinion on management’s assessment and an opinion on the
effectiveness of the Company’s internal control over financial reporting based
on our audit.
We
conducted our audit in accordance with the standards of the Public Company
Accounting Oversight Board (United States). Those standards require that
we plan
and perform the audit to obtain reasonable assurance about whether effective
internal control over financial reporting was maintained in all material
respects. Our audit included obtaining an understanding of internal control
over
financial reporting, evaluating management’s assessment, testing and evaluating
the design and operating effectiveness of internal control, and performing
such
other procedures as we considered necessary in the circumstances. We believe
that our audit provides a reasonable basis for our opinion.
A
company’s internal control over financial reporting is a process designed to
provide reasonable assurance regarding the reliability of financial reporting
and the preparation of financial statements for external purposes in accordance
with generally accepted accounting principles. A company’s internal control over
financial reporting includes those policies and procedures that (1) pertain
to
the maintenance of records that, in reasonable detail, accurately and fairly
reflect the transactions and dispositions of the assets of the company; (2)
provide reasonable assurance that transactions are recorded as necessary
to
permit preparation of financial statements in accordance with generally accepted
accounting principles, and that receipts and expenditures of the company
are
being made only in accordance with authorizations of management and directors
of
the company; and (3) provide reasonable assurance regarding prevention or
timely
detection of unauthorized acquisition, use, or disposition of the company’s
assets that could have a material effect on the financial
statements.
Because
of its inherent limitations, internal control over financial reporting may
not
prevent or detect misstatements. Also, projections of any evaluation of
effectiveness to future periods are subject to the risk that controls may
become
inadequate because of changes in conditions, or that the degree of compliance
with the policies or procedures may deteriorate.
In
our
opinion, management’s assessment that Microchip Technology Incorporated
maintained effective internal control over financial reporting as of March
31,
2007, is fairly stated, in all material respects, based on the COSO criteria.
Also, in our opinion, Microchip Technology Incorporated maintained, in all
material respects, effective internal control over financial reporting as
of
March 31, 2007, based on the COSO criteria.
We
also
have audited, in accordance with the standards of the Public Company Accounting
Oversight Board (United States), the March 31, 2007 consolidated financial
statements of Microchip Technology Incorporated and our report dated May
23,
2007 expressed an unqualified opinion thereon.
/s/ Ernst
& Young LLP
Phoenix,
Arizona
May
23,
2007
37
|
Item
9B.
|
OTHER
INFORMATION
|
None.
PART
III
|
Item
10.
|
DIRECTORS,
EXECUTIVE OFFICERS AND CORPORATE
GOVERNANCE
|
Information
on the members of our Board of Directors is incorporated herein by reference
to
our proxy statement for our 2007 annual meeting of stockholders under the
captions “The Board of Directors,” and “Proposal One – Election of
Directors.”
Information
on the composition of our audit committee and the members of our audit
committee, including information on our audit committee financial experts,
is
incorporated by reference to our proxy statement for our 2007 annual meeting
of
stockholders under the caption “The Board of Directors – Committees of the Board
of Directors – Audit Committee.”
Information
on our executive officers is provided in Item 1, Part I of this Form 10-K
under
the caption “Executive Officers” at page 10, above.
Information
with respect to compliance with Section 16(a) of the Securities Exchange
Act of
1934, as amended, is incorporated herein by reference to our proxy statement
for
our 2007 annual meeting of stockholders under the caption “Section 16(a)
Beneficial Ownership Reporting Compliance.”
Information
with respect to our code of ethics that applies to our directors, executive
officers (including our principal executive officer and our principal financial
and accounting officer) and employees is incorporated by reference to our
proxy
statement for our 2007 annual meeting of stockholders under the caption “Code of
Ethics.” A copy of the Code of Ethics is available on our website at
the Investor Relations section under Mission Statement/Corporate Governance
on
www.microchip.com.
Information
regarding material changes, if any, to procedures by which security holders
may
recommend nominees to our Board of Directors is incorporated by reference
to our
proxy statement for the 2007 annual meeting of stockholders under the caption
“Requirements, Including Deadlines, for Receipt of Stockholder Proposals for
the
2008 Annual Meeting of Stockholders; Discretionary Authority to Vote on
Stockholder Proposals.”
|
Item
11.
|
EXECUTIVE
COMPENSATION
|
Information
with respect to executive compensation is incorporated herein by reference
to
the information under the caption “Executive Compensation” in our proxy
statement for our 2007 annual meeting of stockholders.
Information
with respect to director compensation is incorporated herein by reference
to the
information under the caption “The Board of Directors – Director Compensation”
in our proxy statement for our 2007 annual meeting of stockholders.
Information
with respect to compensation committee interlocks and insider participation
in
compensation decisions is incorporated herein by reference to the information
under the caption “The Board of Directors – Compensation Committee Interlocks
and Insider Participation” in our proxy statement for our 2007 annual meeting of
stockholders.
Our
Board
compensation committee report on executive compensation is incorporated herein
by reference to the information under the caption “Executive Compensation –
Compensation Committee Report on Executive Compensation” in our proxy statement
for our 2007 annual meeting of stockholders.
|
Item
12.
|
SECURITY
OWNERSHIP OF CERTAIN BENEFICIAL OWNERS AND MANAGEMENT AND RELATED
STOCKHOLDER MATTERS
|
Information
with respect to securities authorized for issuance under our equity compensation
plans is incorporated herein by reference to the information under the caption
“Executive Compensation – Equity Compensation Plan Information” in our proxy
statement for our 2007 annual meeting of stockholders.
Information
with respect to security ownership of certain beneficial owners, members
of our
Board of Directors and management is incorporated herein by reference to
the information under the caption “Security Ownership of Principal Stockholders,
Directors and Executive Officers” in our proxy statement for our 2007 annual
meeting of stockholders.
38
|
Item
13.
|
CERTAIN
RELATIONSHIPS AND RELATED TRANSACTIONS, AND DIRECTOR
INDEPENDENCE
|
The
information required by this Item pursuant to Item 404 of Regulation S-K
is
incorporated by reference to the information under the caption “Certain
Transactions” contained in our proxy statement for our 2007 annual meeting of
stockholders.
The
information required by this Item pursuant to Item 407(a) of Regulation S-K
regarding the independence of our directors is incorporated by reference
to the
information under the caption “Meetings of the Board of Directors” contained in
our proxy statement for our 2007 annual meeting of stockholders.
|
Item
14.
|
PRINCIPAL
ACCOUNTANT FEES AND
SERVICES
|
The
information required by this Item related to principal accountant fees and
services as well as related pre-approval policies is incorporated by reference
to the information under the caption “Independent Registered Public Accounting
Firm” contained in our proxy statement for our 2007 annual meeting of
stockholders.
[Remainder
of page intentionally left blank.]
39
PART
IV
|
Item
15.
|
EXHIBITS
AND FINANCIAL STATEMENT
SCHEDULES
|
(a) The
following documents are filed as part of this Form 10-K:
|
Page
No.
|
||
|
(1)
|
Financial
Statements:
|
|
|
Report
of Independent Registered Public Accounting Firm
|
F-1
|
|
|
Consolidated
Balance Sheets as of March 31, 2007 and 2006
|
F-2
|
|
|
Consolidated
Statements of Income for each of the three years in the
period
ended March 31, 2007
|
F-3
|
|
|
Consolidated
Statements of Cash Flows for each of the three years in the
period
ended March 31, 2007
|
F-4
|
|
|
Consolidated
Statements of Stockholders’ Equity for each of the three years in the
period ended March 31, 2007
|
F-5
|
|
|
Notes
to Consolidated Financial Statements
|
F-6
|
|
|
(2)
|
Financial
Statement Schedules – Applicable schedules have been omitted
because
information
is included in the footnotes to the Financial Statements.
|
|
|
(3)
|
The
Exhibits filed with this Form 10-K or incorporated herein by reference
are
set
forth
in the Exhibit Index beginning on page 42 hereof, which Exhibit Index
is incorporated herein by this reference.
|
42
|
(b) See
Item 15(a)(3) above.
(c) See
“Index to Financial Statements” included under Item 8 to this Form
10-K.
40
Pursuant
to the requirements of Section 13 or 15(d) of the Securities Exchange Act
of
1934, the registrant has duly caused this report to be signed on its behalf
by
the undersigned, thereunto duly authorized.
|
MICROCHIP
TECHNOLOGY INCORPORATED
|
|
|
(Registrant)
|
|
|
Date: May
25, 2007
|
By: /s/
Steve Sanghi
|
|
Steve
Sanghi
|
|
|
President
and Chief Executive
Officer
|
Pursuant to the requirements of the Securities Exchange Act of 1934, this report has been signed below by the following persons on behalf of the registrant and in the capacities and on the dates indicated.
|
Name
and Signature
|
Title
|
Date
|
||
|
/s/
Steve Sanghi
|
Director,
President and Chief
Executive Officer
|
May
25, 2007
|
||
|
Steve
Sanghi
|
||||
|
/s/
Albert J. Hugo-Martinez
|
Director
|
May
25, 2007
|
||
|
Albert
J. Hugo-Martinez
|
||||
|
/s/
L.B. Day
|
Director
|
May
25, 2007
|
||
|
L.B.
Day
|
||||
|
/s/
Matthew W. Chapman
|
Director
|
May
25, 2007
|
||
|
Matthew
W. Chapman
|
||||
|
/s/
Wade F. Meyercord
|
Director
|
May
25, 2007
|
||
|
Wade
F. Meyercord
|
||||
|
/s/
Gordon W. Parnell
|
Vice
President and Chief Financial Officer
|
May
25, 2007
|
||
|
Gordon
W. Parnell
|
(Principal
Financial and Accounting Officer)
|
|||
|
|
||||
41
EXHIBITS
|
Incorporated
by Reference
|
||||||
|
Exhibit
Number
|
Exhibit
Description
|
Form
|
File
Number
|
Exhibit
|
Filing
Date
|
Filed
Herewith
|
|
2.1
|
Purchase
and Sale Agreement, dated as of July 18, 2002 between Registrant
and
Fujitsu Microelectronics, Inc.
|
8-K
|
000-21184
|
2.1
|
7/18/02
|
|
|
3.1
|
Restated
Certificate of Incorporation of Registrant
|
10-Q
|
000-21184
|
3.1
|
11/12/02
|
|
|
3.2
|
Amended
and Restated By-Laws of Registrant, as amended through January
29,
2007
|
10-Q
|
000-21184
|
3.1
|
2/6/07
|
|
|
4.1
|
First
Amendment to Rights Agreement dated January 9, 2007
|
10-Q
|
000-21184
|
4.1
|
2/6/07
|
|
|
4.2
|
Amended
and Restated Preferred Shares Rights Agreement, dated as of October
11,
1999, between Registrant and Norwest Bank Minnesota,
N.A., including the Amended Certificate of Designations, the
form of Rights Certificate and the Summary of Rights, attached
as exhibits
thereto
|
8-K
|
000-21184
|
4.1
|
10/12/99
|
|
|
10.1
|
Form
of Indemnification Agreement between Registrant and its directors
and
certain of its officers
|
S-1
|
33-57960
|
10.1
|
2/5/93
|
|
|
10.2
|
2004
Equity Incentive Plan as amended and restated by the Board on May
1,
2006
|
10-Q
|
000-21184
|
10.3
|
2/6/07
|
|
|
10.3
|
*Form
of Notice of Grant for 2004 Equity Incentive Plan (including Exhibit
A
Stock Option Agreement)
|
S-8
|
333-119939
|
4.5
|
10/25/04
|
|
|
10.4
|
*Form
of Notice of Grant (foreign) for 2004 Equity Incentive Plan (including
Exhibit A Stock Option Agreement (foreign)
|
10-K
|
000-21184
|
10.4
|
5/23/05
|
|
|
10.5
|
*Form
of Notice of Grant of Restricted Stock Units for 2004 Equity Incentive
Plan (including Exhibit A Restricted Stock Units
Agreement)
|
10-K
|
000-21184
|
10.6
|
5/31/06
|
|
|
10.6
|
*1993
Stock Option Plan, as Amended through August 16, 2002
|
10-Q
|
000-21184
|
10.1
|
11/12/02
|
|
|
10.7
|
*Form
of Notice of Grant For 1993 Stock Option Plan, with Exhibit A thereto,
Form of Stock Option Agreement; and Exhibit B thereto, Form of
Stock
Purchase Agreement
|
S-8
|
333-872
|
10.6
|
1/23/96
|
|
|
10.8
|
*Microchip
Technology Incorporated 2001 Employee Stock Purchase Plan as amended
through August 15, 2003 (including Enrollment Form, Stock Purchase
Agreement, and Change Form)
|
S-8
|
333-140773
|
4.4
|
2/16/07
|
|
|
10.9
|
*1997
Nonstatutory Stock Option Plan, as Amended Through March 3,
2003
|
10-K
|
000-21184
|
10.13
|
6/5/03
|
|
42
EXHIBITS
|
Incorporated
by Reference
|
||||||
|
Exhibit
Number
|
Exhibit
Description
|
Form
|
File
Number
|
Exhibit
|
Filing
Date
|
Filed
Herewith
|
|
10.10
|
*Form
of Notice of Grant For 1997 Nonstatutory Stock Option Plan, with
Exhibit A
thereto, Form of Stock Option Agreement
|
10-K
|
000-21184
|
10.17
|
5/27/98
|
|
|
10.11
|
Microchip
Technology Incorporated International Employee Stock Purchase Plan,
as
amended through May 1, 2006
|
S-8
|
333-140773
|
4.1
|
2/16/07
|
|
|
10.12
|
Microchip
Technology Incorporated International Stock Purchase Agreement
(including
attached Form of Enrollment Form)
|
S-8
|
333-140773
|
4.2
|
2/16/07
|
|
|
10.13
|
Form
of Change Form for Microchip Technology Incorporated International
Employee Stock Purchase Plan
|
S-8
|
333-140773
|
4.3
|
2/16/07
|
|
|
10.14
|
*Executive
Management Incentive Compensation Plan
|
10-Q
|
000-21184
|
10.4
|
2/6/07
|
|
|
10.15
|
*Discretionary
Executive Management Incentive compensation Plan
|
10-Q
|
000-21184
|
10.5
|
2/6/07
|
|
|
10.16
|
*Management
Incentive Compensation Plan
|
10-Q
|
000-21184
|
10.6
|
2/6/07
|
|
|
10.17
|
TelCom
Semiconductor, Inc. 1994 Stock Option Plan and forms of agreements
thereunder
|
S-8
|
333-53876
|
4.1
|
1/18/01
|
|
|
10.18
|
TelCom
Semiconductor, Inc. 2000 Nonstatutory Stock Option Plan and forms
of
agreements used thereunder
|
S-8
|
333-53876
|
4.4
|
1/18/01
|
|
|
10.19
|
PowerSmart,
Inc. 1998 Stock Incentive Plan, Including Forms of Incentive Stock
Option
Agreement and Nonqualified Stock Option Agreement
|
S-8
|
333-96791
|
4.1
|
7/19/02
|
|
|
10.20
|
*February
3, 2003 Amendment to the Adoption Agreement to the Microchip Technology
Incorporated Supplemental Retirement Plan
|
10-K
|
000-21184
|
10.28
|
6/5/03
|
|
|
10.21
|
*Amendment
dated August 29, 2001 to the Microchip Technology Incorporated
Supplemental Retirement Plan
|
S-8
|
333-101696
|
4.1.2
|
12/6/02
|
|
|
10.22
|
*Amendment
Dated December 9, 1999 to the Adoption Agreement to the Microchip
Technology Incorporated Supplemental Retirement Plan
|
S-8
|
333-101696
|
4.1.4
|
12/6/02
|
|
|
10.23
|
*Adoption
Agreement to the Microchip Technology Incorporated Supplemental
Retirement
Plan dated January 1, 1997
|
S-8
|
333-101696
|
4.1.3
|
12/6/02
|
|
|
10.24
|
*Microchip
Technology Incorporated Supplemental Retirement Plan
|
S-8
|
333-101696
|
4.1.1
|
12/6/02
|
|
43
EXHIBITS
|
Incorporated
by Reference
|
||||||
|
Exhibit
Number
|
Exhibit
Description
|
Form
|
File
Number
|
Exhibit
|
Filing
Date
|
Filed
Herewith
|
|
10.25
|
*Amendments
to Supplemental Retirement Plan
|
10-Q
|
000-21184
|
10.1
|
2/9/06
|
|
|
10.26
|
*Change
of Control Severance Agreement
|
10-Q
|
000-21184
|
10.1
|
2/6/07
|
|
|
10.27
|
*Change
of Control Severance Agreement
|
10-Q
|
000-21184
|
10.2
|
2/6/07
|
|
|
10.28
|
Development
Agreement dated as of August 29, 1997 by and between Registrant
and the
City of Chandler, Arizona
|
10-Q
|
000-21184
|
10.1
|
2/13/98
|
|
|
10.29
|
Addendum
to Development Agreement by and between Registrant and the City
of Tempe,
Arizona, dated May 11, 2000
|
10-K
|
000-21184
|
10.14
|
5/15/01
|
|
|
10.30
|
Development
Agreement dated as of July 17, 1997 by and between Registrant and
the City
of Tempe, Arizona
|
10-Q
|
000-21184
|
10.2
|
2/13/98
|
|
|
10.31
|
Strategic
Investment Program Contract dated as of August 15, 2002 by and
between
Registrant, Multnomah County, Oregon and City of Gresham,
Oregon
|
8-K
|
000-21184
|
2.2
|
8/23/02
|
|
|
21.1
|
Subsidiaries
of Registrant
|
X
|
||||
|
23.1
|
Consent
of Independent Registered Public Accounting Firm
|
X
|
||||
|
24.1
|
Power
of Attorney re: Microchip Technology Incorporated, the
Registrant
|
10-K
|
000-21184
|
24.1
|
6/7/00
|
|
|
31.1
|
Certification
of Chief Executive Officer Pursuant to Rule 13a-14(a) of the
Securities Exchange Act of 1934, as amended (the Exchange
Act)
|
X
|
||||
|
31.2
|
Certification
of Chief Financial Officer Pursuant to Rule 13a-14(a) of the
Securities Exchange Act of 1934, as amended (the Exchange
Act)
|
X
|
||||
|
32
|
Certifications
Pursuant to 18 U.S.C. Section 1350, as adopted pursuant to Section
906 of
the Sarbanes-Oxley Act of 2002
|
X
|
||||
|
*Compensation
plans or arrangements in which directors or executive officers
are
eligible to participate
|
||||||
44
Annual
Report on Form 10-K
Item
8,
Item 15(a)(1) and (2), (b) and (c)
_________________________________
INDEX
TO
FINANCIAL STATEMENTS
CONSOLIDATED
FINANCIAL STATEMENTS
EXHIBITS
_________________________________
YEAR
ENDED MARCH 31, 2007
MICROCHIP
TECHNOLOGY INCORPORATED
AND
SUBSIDIARIES
CHANDLER,
ARIZONA
MICROCHIP
TECHNOLOGY INCORPORATED AND SUBSIDIARIES
Index
to
Consolidated Financial Statements
|
Page
Number
|
|
i
The
Board of Directors and Stockholders of
Microchip
Technology Incorporated and subsidiaries
We
have
audited the accompanying consolidated balance sheets of Microchip Technology
Incorporated and subsidiaries as of March 31, 2007 and 2006, and the related
consolidated statements of income, stockholders’ equity, and cash flows for each
of the three years in the period ended March 31, 2007. These financial
statements are the responsibility of the company’s management. Our
responsibility is to express an opinion on these financial statements based
on
our audits.
We
conducted our audits in accordance with the standards of the Public Company
Accounting Oversight Board (United States). Those standards require that
we plan
and perform the audit to obtain reasonable assurance about whether the financial
statements are free of material misstatement. An audit includes examining,
on a
test basis, evidence supporting the amounts and disclosures in the financial
statements. An audit also includes assessing the accounting principles used
and
significant estimates made by management, as well as evaluating the overall
financial statement presentation. We believe that our audits provide a
reasonable basis for our opinion.
In
our
opinion, the consolidated financial statements referred to above present
fairly,
in all material respects, the consolidated financial position of Microchip
Technology Incorporated and subsidiaries at March 31, 2007 and 2006, and
the
consolidated results of their operations and their cash flows for each of
the
three years in the period ended March 31, 2007, in conformity with U.S.
generally accepted accounting principles.
As
discussed in Note 1 to the consolidated financial statements, Microchip
Technology Incorporated changed its method of accounting for Share-Based
Payments in accordance with Statement of Financial Accounting Standards No.
123
(revised 2004) on April 1, 2006.
We
also
have audited, in accordance with the standards of the Public Company Accounting
Oversight Board (United States), the effectiveness of Microchip Technology
Incorporated’s internal control over financial reporting as of March 31, 2007,
based on criteria established in Internal Control—Integrated Framework issued by
the Committee of Sponsoring Organizations of the Treadway Commission and
our
report dated May 23, 2007 expressed an unqualified opinion thereon.
/s/ Ernst
& Young LLP
Phoenix,
Arizona
May
23,
2007
F-1
|
MICROCHIP
TECHNOLOGY INCORPORATED AND SUBSIDIARIES
|
||||||||
|
CONSOLIDATED
BALANCE
SHEETS
|
||||||||
|
(in
thousands, except share and per share amounts)
|
||||||||
|
ASSETS
|
||||||||
|
March
31,
|
||||||||
|
2007
|
2006
|
|||||||
|
Cash
and cash equivalents
|
$ |
167,477
|
$ |
565,273
|
||||
|
Short-term
investments
|
583,000
|
199,491
|
||||||
|
Accounts
receivable, net
|
124,559
|
139,361
|
||||||
|
Inventories
|
121,024
|
115,024
|
||||||
|
Prepaid
expenses
|
15,547
|
11,369
|
||||||
|
Deferred
tax assets
|
61,983
|
78,544
|
||||||
|
Other
current assets
|
11,147
|
9,767
|
||||||
|
Total
current assets
|
1,084,737
|
1,118,829
|
||||||
|
Property,
plant and equipment, net
|
605,722
|
659,972
|
||||||
|
Long-term
investments
|
527,910
|
520,360
|
||||||
|
Goodwill
|
31,886
|
31,886
|
||||||
|
Intangible
assets, net
|
8,456
|
9,489
|
||||||
|
Other
assets
|
10,830
|
10,060
|
||||||
|
Total
assets
|
$ |
2,269,541
|
$ |
2,350,596
|
||||
|
LIABILITIES
AND STOCKHOLDERS' EQUITY
|
||||||||
|
Accounts
payable
|
$ |
34,675
|
$ |
50,847
|
||||
|
Accrued
liabilities
|
129,882
|
189,687
|
||||||
|
Deferred
income on shipments to distributors
|
91,363
|
99,481
|
||||||
|
Short-term
debt
|
---
|
268,954
|
||||||
|
Total
current liabilities
|
255,920
|
608,969
|
||||||
|
Other
long-term liabilities
|
926
|
801
|
||||||
|
Deferred
tax liability
|
8,327
|
14,637
|
||||||
|
Stockholders' equity:
|
||||||||
|
Preferred
stock, $0.001 par value; authorized 5,000,000 shares;
|
||||||||
|
no
shares issued or outstanding.
|
---
|
---
|
||||||
|
Common
stock, $0.001 par value; authorized 450,000,000 shares;
|
||||||||
|
issued
and outstanding 217,439,960 shares at March 31, 2007;
|
||||||||
|
issued
and outstanding 213,614,343 shares at March 31, 2006.
|
217
|
214
|
||||||
|
Additional
paid-in capital
|
755,834
|
639,238
|
||||||
|
Retained
earnings
|
1,255,486
|
1,106,355
|
||||||
|
Deferred
share-based compensation
|
---
|
(5,705 | ) | |||||
|
Accumulated
other comprehensive loss
|
(7,169 | ) | (13,913 | ) | ||||
|
Net
stockholders' equity
|
2,004,368
|
1,726,189
|
||||||
|
Total
liabilities and stockholders' equity
|
$ |
2,269,541
|
$ |
2,350,596
|
||||
|
See
accompanying notes to consolidated financial statements
|
||||||||
F-2
|
MICROCHIP
TECHNOLOGY INCORPORATED AND SUBSIDIARIES
|
||||||||||||
|
CONSOLIDATED
STATEMENTS
OF
INCOME
|
||||||||||||
|
(in
thousands, except per share amounts)
|
||||||||||||
|
Year
ended March 31,
|
||||||||||||
|
2007
|
2006
|
2005
|
||||||||||
|
Net
sales
|
$ |
1,039,671
|
$ |
927,893
|
$ |
846,936
|
||||||
|
Cost
of sales (1)
|
414,915
|
377,016
|
362,961
|
|||||||||
|
Gross
profit
|
624,756
|
550,877
|
483,975
|
|||||||||
|
Operating
expenses:
|
||||||||||||
|
Research
and development (1)
|
113,698
|
94,926
|
93,040
|
|||||||||
|
Selling,
general and administrative (1)
|
163,247
|
129,587
|
111,188
|
|||||||||
|
Special
charges
|
---
|
---
|
21,100
|
|||||||||
|
276,945
|
224,513
|
225,328
|
||||||||||
|
Operating
income
|
347,811
|
326,364
|
258,647
|
|||||||||
|
Other
income (expense):
|
||||||||||||
|
Interest
income
|
58,383
|
32,753
|
17,804
|
|||||||||
|
Interest
expense
|
(5,416 | ) | (1,967 | ) | (940 | ) | ||||||
|
Other,
net
|
312
|
2,035
|
1,757
|
|||||||||
|
Income
before income taxes
|
401,090
|
359,185
|
277,268
|
|||||||||
|
Income
tax provision
|
44,061
|
116,816
|
63,483
|
|||||||||
|
Net
income
|
$ |
357,029
|
$ |
242,369
|
$ |
213,785
|
||||||
|
See
accompanying notes to condensed consolidated financial
statements
Basic
net income per common share
|
$ |
1.66
|
$ |
1.15
|
$ |
1.03
|
||||||
|
Diluted
net income per common share
|
$ |
1.62
|
$ |
1.13
|
$ |
1.01
|
||||||
|
Dividends
declared per common share
|
$ |
0.965
|
$ |
0.570
|
$ |
0.208
|
||||||
|
Basic
common shares outstanding
|
215,498
|
210,104
|
206,740
|
|||||||||
|
Diluted
common shares outstanding
|
220,848
|
215,024
|
211,962
|
|||||||||
|
(1)
Includes share-based compensation charges as follow:
|
||||||||||||
|
Cost
of sales
|
$ |
3,255
|
$ |
---
|
$ |
---
|
||||||
|
Research
and development
|
9,623
|
214
|
---
|
|||||||||
|
Selling,
general and administrative
|
14,501
|
364
|
---
|
|||||||||
|
See
accompanying notes to consolidated financial statements
|
||||||||||||
F-3
|
MICROCHIP
TECHNOLOGY INCORPORATED AND SUBSIDIARIES
|
||||||||||||
|
CONSOLIDATED
STATEMENTS
OF CASH
FLOWS
|
||||||||||||
|
(in
thousands)
|
||||||||||||
|
Year
ended March 31,
|
||||||||||||
|
2007
|
2006
|
2005
|
||||||||||
|
Cash
flows from operating activities:
|
||||||||||||
|
Net
income
|
$ |
357,029
|
$ |
242,369
|
$ |
213,785
|
||||||
|
Adjustments
to reconcile net income to net cash provided by operating
|
||||||||||||
|
activities:
|
||||||||||||
|
Depreciation
and amortization
|
116,171
|
110,682
|
120,466
|
|||||||||
|
Deferred
income taxes
|
9,023
|
17,516
|
16,869
|
|||||||||
|
Share-based
compensation
|
27,379
|
578
|
---
|
|||||||||
|
Excess
tax benefit from share-based payment arrangements
|
(22,788 | ) |
---
|
---
|
||||||||
|
Tax
benefit from equity incentive plans
|
22,862
|
29,377
|
15,296
|
|||||||||
|
Gain
on sale of assets
|
(364 | ) | (998 | ) | (1,224 | ) | ||||||
|
Changes
in operating assets and liabilities:
|
||||||||||||
|
Decrease
(increase) in accounts receivable
|
14,802
|
(26,273 | ) | (5,198 | ) | |||||||
|
Increase
in inventories
|
(2,663 | ) | (11,296 | ) | (9,214 | ) | ||||||
|
(Decrease)
increase in deferred income on shipments to distributors
|
(8,118 | ) |
7,751
|
6,914
|
||||||||
|
(Decrease)
increase in accounts payable and accrued liabilities
|
(75,978 | ) |
72,053
|
1,178
|
||||||||
|
Change
in other assets and liabilities
|
(7,586 | ) | (4,436 | ) | (6,162 | ) | ||||||
|
Net
cash provided by operating activities
|
429,769
|
437,323
|
352,710
|
|||||||||
|
Cash
flows from investing activities:
|
||||||||||||
|
Purchases
of investments
|
(1,327,042 | ) | (856,748 | ) | (1,061,237 | ) | ||||||
|
Sales
and maturities of investments
|
943,955
|
797,694
|
752,060
|
|||||||||
|
Investment
in other assets
|
(844 | ) | (2,595 | ) |
---
|
|||||||
|
Proceeds
from sale of assets
|
1,746
|
1,341
|
1,659
|
|||||||||
|
Capital
expenditures
|
(60,039 | ) | (76,294 | ) | (63,211 | ) | ||||||
|
Net
cash used in investing activities
|
(442,224 | ) | (136,602 | ) | (370,729 | ) | ||||||
|
Cash
flows from financing activities:
|
||||||||||||
|
Payment
of cash dividend
|
(207,898 | ) | (120,109 | ) | (42,997 | ) | ||||||
|
Proceeds
from sale of common stock
|
68,723
|
95,751
|
47,234
|
|||||||||
|
Excess
tax benefit from share-based payment arrangements
|
22,788
|
---
|
---
|
|||||||||
|
Repurchase
of common stock
|
---
|
(3,320 | ) | (68,276 | ) | |||||||
|
Proceeds
from short-term borrowings
|
---
|
268,954
|
45,454
|
|||||||||
|
Payments
on short-term borrowings
|
(268,954 | ) | (45,454 | ) |
---
|
|||||||
|
Net
cash (used in) provided by financing activities
|
(385,341 | ) |
195,822
|
(18,585 | ) | |||||||
|
Net
(decrease) increase in cash and cash
equivalents
|
(397,796 | ) |
496,543
|
(36,604 | ) | |||||||
|
Cash
and cash equivalents at beginning of year
|
565,273
|
68,730
|
105,334
|
|||||||||
|
Cash
and cash equivalents at end of year
|
$ |
167,477
|
$ |
565,273
|
$ |
68,730
|
||||||
|
See
accompanying notes to consolidated financial statements
|
||||||||||||
F-4
|
MICROCHIP
TECHNOLOGY INCORPORATED AND SUBSIDIARIES
|
||||||||||||||||||||||||||||||||
|
CONSOLIDATED
STATEMENTS
OF STOCKHOLDERS'
EQUITY
|
||||||||||||||||||||||||||||||||
|
(in
thousands)
|
||||||||||||||||||||||||||||||||
|
Common
Stock and
|
Common
Stock held
|
Accum
Other
|
Deferred
|
Net
|
||||||||||||||||||||||||||||
|
Additional
Paid-in Capital
|
in
Treasury
|
Comprehensive
|
Share-based
|
Retained
|
Stockholders'
|
|||||||||||||||||||||||||||
|
Shares
|
Amount
|
Shares
|
Amount
|
Income
(Loss)
|
Compensation
|
Earnings
|
Equity
|
|||||||||||||||||||||||||
|
Balance
at March 31, 2004
|
208,556
|
$ |
558,561
|
1,967
|
$ | (52,084 | ) | $ |
733
|
---
|
$ |
813,307
|
$ |
1,320,517
|
||||||||||||||||||
|
Components
of other comprehensive income:
|
||||||||||||||||||||||||||||||||
|
Net
income
|
---
|
---
|
---
|
---
|
---
|
---
|
213,785
|
213,785
|
||||||||||||||||||||||||
|
Net
unrealized losses on available-for-sale
|
||||||||||||||||||||||||||||||||
|
investments,
net of $2,068 of tax
|
---
|
---
|
---
|
---
|
(10,451 | ) |
---
|
---
|
(10,451 | ) | ||||||||||||||||||||||
|
Total
comprehensive income
|
---
|
---
|
---
|
---
|
---
|
---
|
---
|
203,334
|
||||||||||||||||||||||||
|
Issuances
from equity incentive plans
|
2,882
|
36,831
|
---
|
---
|
---
|
---
|
---
|
36,831
|
||||||||||||||||||||||||
|
Employee
stock purchase plan
|
452
|
10,403
|
---
|
---
|
---
|
---
|
---
|
10,403
|
||||||||||||||||||||||||
|
Purchase
of treasury stock
|
---
|
---
|
2,185
|
(57,666 | ) |
---
|
---
|
---
|
(57,666 | ) | ||||||||||||||||||||||
|
Treasury
stock used for new issuances
|
(3,334 | ) | (88,233 | ) | (3,334 | ) |
88,233
|
---
|
---
|
---
|
---
|
|||||||||||||||||||||
|
Tax
benefit from equity incentive plans
|
---
|
15,296
|
---
|
---
|
---
|
---
|
---
|
15,296
|
||||||||||||||||||||||||
|
Unearned
share-based compensation amortization
|
---
|
16
|
---
|
---
|
---
|
---
|
---
|
16
|
||||||||||||||||||||||||
|
Cash
dividend
|
---
|
---
|
---
|
---
|
---
|
---
|
(42,997 | ) | (42,997 | ) | ||||||||||||||||||||||
|
Balance
at March 31, 2005
|
208,556
|
532,874
|
818
|
(21,517 | ) | (9,718 | ) |
---
|
984,095
|
1,485,734
|
||||||||||||||||||||||
|
Components
of other comprehensive income:
|
||||||||||||||||||||||||||||||||
|
Net
income
|
---
|
---
|
---
|
---
|
---
|
---
|
242,369
|
242,369
|
||||||||||||||||||||||||
|
Net
unrealized losses on available-for-sale
|
||||||||||||||||||||||||||||||||
|
investments,
net of $882 of tax
|
---
|
---
|
---
|
---
|
(4,195 | ) |
---
|
---
|
(4,195 | ) | ||||||||||||||||||||||
|
Total
comprehensive income
|
---
|
---
|
---
|
---
|
---
|
---
|
---
|
238,174
|
||||||||||||||||||||||||
|
Issuances
from equity incentive plans
|
5,561
|
85,735
|
---
|
---
|
---
|
---
|
---
|
85,735
|
||||||||||||||||||||||||
|
Employee
stock purchase plan
|
435
|
10,016
|
---
|
---
|
---
|
---
|
---
|
10,016
|
||||||||||||||||||||||||
|
Purchase
of treasury stock
|
---
|
---
|
120
|
(3,320 | ) |
---
|
---
|
---
|
(3,320 | ) | ||||||||||||||||||||||
|
Treasury
stock used for new issuances
|
(938 | ) | (24,837 | ) | (938 | ) |
24,837
|
---
|
---
|
---
|
---
|
|||||||||||||||||||||
|
Tax
benefit from equity incentive plans
|
---
|
29,377
|
---
|
---
|
---
|
---
|
---
|
29,377
|
||||||||||||||||||||||||
|
Unearned
share-based compensation amortization
|
---
|
4
|
---
|
---
|
---
|
---
|
---
|
4
|
||||||||||||||||||||||||
|
Issuance
of share-based compensation, net
|
---
|
6,283
|
---
|
---
|
---
|
(5,705 | ) |
---
|
578
|
|||||||||||||||||||||||
|
Cash
dividend
|
---
|
---
|
---
|
---
|
---
|
---
|
(120,109 | ) | (120,109 | ) | ||||||||||||||||||||||
|
Balance
at March 31, 2006
|
213,614
|
639,452
|
---
|
---
|
(13,913 | ) | (5,705 | ) |
1,106,355
|
1,726,189
|
||||||||||||||||||||||
|
Components
of other comprehensive income:
|
||||||||||||||||||||||||||||||||
|
Net
income
|
---
|
---
|
---
|
---
|
---
|
---
|
357,029
|
357,029
|
||||||||||||||||||||||||
|
Net
unrealized gains on available-for-sale
|
||||||||||||||||||||||||||||||||
|
investments,
net of $1,228 of tax
|
---
|
---
|
---
|
---
|
6,744
|
---
|
---
|
6,744
|
||||||||||||||||||||||||
|
Total
comprehensive income
|
---
|
---
|
---
|
---
|
---
|
---
|
---
|
363,773
|
||||||||||||||||||||||||
|
Issuances
from equity incentive plans
|
3,435
|
57,322
|
---
|
---
|
---
|
---
|
---
|
57,322
|
||||||||||||||||||||||||
|
Employee
stock purchase plan
|
391
|
11,401
|
---
|
---
|
---
|
---
|
---
|
11,401
|
||||||||||||||||||||||||
|
Tax
benefit from equity incentive plans
|
---
|
22,862 |
---
|
---
|
---
|
---
|
---
|
22,862
|
||||||||||||||||||||||||
| Reclassification - adoption of SFAS No. 123R | --- | (5,705 | ) | --- | --- | --- |
5,705
|
--- | --- | |||||||||||||||||||||||
|
Unearned
share-based compensation amortization
|
---
|
2
|
---
|
---
|
---
|
---
|
---
|
2
|
||||||||||||||||||||||||
|
Issuance
of share-based compensation
|
---
|
30,717
|
---
|
---
|
---
|
---
|
---
|
30,717
|
||||||||||||||||||||||||
|
Cash
dividend
|
---
|
---
|
---
|
---
|
---
|
---
|
(207,898 | ) | (207,898 | ) | ||||||||||||||||||||||
|
Balance
at March 31, 2007
|
217,440
|
$ |
756,051
|
---
|
---
|
$ | (7,169 | ) |
---
|
$ |
1,255,486
|
$ |
2,004,368
|
|||||||||||||||||||
|
See
accompanying notes to consolidated financial statements
|
||||||||||||||||||||||||||||||||
F-5
MICROCHIP
TECHNOLOGY INCORPORATED AND SUBSIDIARIES
NOTES
TO
CONSOLIDATED FINANCIAL STATEMENTS
|
1.
|
SIGNIFICANT
ACCOUNTING POLICIES
|
Nature
of Business
Microchip
develops and manufactures specialized semiconductor products used by its
customers for a wide variety of embedded control
applications. Microchip’s product portfolio comprises 8- and 16-bit
PIC® microcontrollers and 16-bit dsPIC® digital signal controllers, which
feature on-board Flash (reprogrammable) memory technology. In
addition, Microchip offers a broad spectrum of high-performance linear,
mixed-signal, power management, thermal management, battery management and
interface devices. Microchip also makes serial EEPROMs.
Principles
of Consolidation
The
consolidated financial statements include the accounts of Microchip Technology
Incorporated and its wholly-owned subsidiaries (“Microchip” or the
“Company”). The Company does not have any subsidiaries in which it
does not own 100% of the outstanding stock. All of the Company’s
subsidiaries are included in the consolidated financial
statements. All significant intercompany accounts and transactions
have been eliminated in consolidation.
Revenue
Recognition
The
Company recognizes revenue when the earnings process is complete, as evidenced
by an agreement with the customer, transfer of title as well as fixed pricing
and probable collectability. The Company recognizes revenue from
product sales to OEMs upon shipment and records reserves for estimated customer
returns. Distributors worldwide generally have broad price protection
and product return rights, so the Company defers revenue recognition until
the
distributor sells the product to their customer. The Company reduces
product pricing through price protection based on market conditions, competitive
considerations and other factors. Price protection is granted to
distributors on the inventory that they have on hand at the date the price
protection is offered. When the Company reduces the price of its
products, it allows the distributor to claim a credit against its outstanding
accounts receivable balances based on the new price of the inventory it has
on
hand as of the date of the price reduction. There is no revenue
impact from the price protection. The Company also grants certain
credits to its distributors on specially identified pieces of the distributors’
business to allow them to earn a competitive gross margin on the sale of
the
Company’s products to their end customers. The credits are on a per
unit basis and are not given to the distributor until they provide information
regarding the sale to their end customer. The effect of granting
these credits establishes the net selling price from the Company to its
distributors for the product and results in the net revenue recognized by
the
Company when the product is sold by the distributors to their end
customers. Upon shipment, amounts billed to distributors are included
as accounts receivable, inventory is relieved, the sale and the gross margin
are
deferred and reflected as a current liability until the product is sold by
the
distributor to its customers. Shipping charges billed to customers
are included in net sales, and the related shipping costs are included in
cost
of sales.
Product
Warranty
The
Company generally sells products with a limited warranty related to product
quality and a limited indemnification of customers against intellectual property
infringement claims related to the Company’s products. Due to
comprehensive product testing, the short time between product shipment and
the
detection and correction of product failures, and a low historical rate of
payments on indemnification claims, the accrual based on historical activity
and
the related expense were immaterial significant as of and for the fiscal
years
presented.
Advertising
Costs
The
Company expenses all advertising costs as incurred. Advertising costs
were immaterial for the years ended March 31, 2007, 2006 and 2005.
F-6
Research
and Development
Research
and development costs are expensed as incurred. Research and
development expenses include expenditures for labor, depreciation, masks,
prototype wafers, and expenses for development of process technologies, new
packages, and software to support new products and design
environments.
Foreign
Currency Translation and Forward Contracts
The
Company’s foreign subsidiaries are considered to be extensions of the U.S.
Company and any translation gains and losses related to these subsidiaries
are
included in other income and expense. As the U.S. dollar is utilized
as the functional currency, gains and losses resulting from foreign currency
transactions (transactions denominated in a currency other than the
subsidiaries’ functional currency) are also included in income. Gains
and losses associated with currency rate changes on forward contracts are
recorded currently in income. These gains and losses are immaterial
to the Company’s financial statements.
Income
Taxes
As
part
of the process of preparing its consolidated financial statements, the Company
is required to estimate its income taxes in each of the jurisdictions in
which
it operates. This process involves estimating the Company’s actual
current tax exposure together with assessing temporary differences resulting
from differing treatment of items for tax and accounting
purposes. These differences result in deferred tax assets and
liabilities, which are included within the Company’s consolidated balance
sheet. The Company must then assess the likelihood that its deferred
tax assets will be recovered from future taxable income and to the extent
it
believes that recovery is not likely, it must establish a valuation
allowance. The Company has not provided for a valuation allowance
because management currently believes that it is “more likely than not” that its
deferred tax assets will be recovered from future taxable income.
Cash
and Cash Equivalents
All
highly liquid investments, including marketable securities purchased with
a
remaining maturity of three months or less when acquired are considered to
be
cash equivalents.
Short-term
and Long-term Investments
The
Company’s investments are classified as available-for-sale. These
investments consist of government agency bonds, municipal bonds, state student
loan bonds and floating rate securities. The Company defines
short-term investments as income yielding securities which can be readily
converted to cash and defines long-term investments as income yielding
securities with maturities of over one year that have unrealized losses
attributable to them. The Company has the ability to hold its long-term
investments until such time as these assets are no longer
impaired. Such recovery is not expected to occur within the next
year. The Company’s investments are carried at fair value with
unrealized gains and losses reported in stockholders’ equity. Premiums and
discounts are amortized or accreted over the life of the related
available-for-sale security. Dividend and interest income are
recognized when earned. The cost of securities sold is calculated
using the specific identification method.
Allowance
for Doubtful Accounts
The
Company maintains an allowance for doubtful accounts for estimated losses
resulting from the inability of its customers to make required payments,
which
is included in bad debt expense. The Company determines the adequacy
of this allowance by regularly reviewing the composition of its accounts
receivable aging and evaluating individual customer receivables, considering
such customer’s financial condition, credit history and current economic
conditions.
Inventories
Inventories
are valued at the lower of cost or market using the first-in, first-out
method. The Company writes down its inventory for estimated
obsolescence or unmarketable inventory in an amount equal to the difference
between the cost of inventory and the estimated market value based upon
assumptions about future demand and market conditions. If actual
market conditions are less favorable than those projected by the Company,
additional inventory write-downs may be required. Inventory
impairment charges establish a new cost basis for inventory and charges are
not
subsequently reversed to income even if circumstances later suggest that
increased carrying amounts
F-7
are
recoverable. In estimating reserves for obsolescence, the Company
primarily evaluates estimates of demand over a 12-month period and provides
reserves for inventory on hand in excess of the estimated 12-month
demand.
Property,
Plant and Equipment
Property,
plant and equipment are stated at cost. Major renewals and improvements are
capitalized, while maintenance and repairs are expensed when
incurred. The Company’s property and equipment accounting policies
incorporate estimates, assumptions and judgments relative to the useful lives
of
its property and equipment. Depreciation is provided for assets
placed in service on a straight-line basis over the estimated useful lives
of
the relative assets, which range from 3 to 30 years. The Company
evaluates the carrying value of its property and equipment when events or
changes in circumstances indicate that the carrying value of such assets
may be
impaired. Asset impairment evaluations are, by nature, highly
subjective.
Litigation
The
Company’s estimated range of liability related to pending litigation is based on
claims for which management believes a loss is probable and it can estimate
the
amount or range of loss. Because of the uncertainties related to both
the amount and range of the loss on the pending litigation, the Company is
unable to make a reasonable estimate of the liability that could result from
an
unfavorable outcome. As additional information becomes available, the
Company will assess the potential liability related to its pending litigation
and revise its estimates, if necessary.
Goodwill
Goodwill
is recorded when the purchase price paid for an acquisition exceeds the
estimated fair value of the net identified tangible and intangible assets
acquired. The Company is required to perform an annual impairment
review, and more frequently under certain circumstances. The goodwill is
subjected to this test during the fourth quarter of the Company’s fiscal
year. The Company engages primarily in the design, development,
manufacture and marketing of semiconductor products and, as a result, the
Company concluded there is one reporting unit. The impairment review
process compares the fair value of the reporting unit to its carrying
value. If the Company determines through the impairment process that
goodwill has been impaired, the Company will record the impairment charge
in the
statement of income. As of March 31, 2007, there was no impairment
charge related to goodwill.
Impairment
of Long-Lived Assets
The
Company assesses whether indicators of impairment of long-lived assets are
present. If such indicators are present, the Company determines
whether the sum of the estimated undiscounted cash flows attributable to
the
assets in question is less than their carrying value. If less, the
Company recognizes an impairment loss based on the excess of the carrying
amount
of the assets over their respective fair values. Fair value is
determined by discounted future cash flows, appraisals or other
methods. If the assets determined to be impaired are to be held and
used, the Company recognizes an impairment loss through a charge to operating
results to the extent the present value of anticipated net cash flows
attributable to the asset are less than the asset’s carrying
value. The Company would depreciate the remaining value over the
remaining estimated useful life of the asset.
Share-Based
Compensation
The
Company has equity incentive plans under which non-qualified stock options
and
restricted stock units (RSUs) have been granted to employees and under which
non-qualified stock options have been granted to non-employee members of
the
Board of Directors. In the second half of fiscal 2006, the Company
adopted RSUs as its primary equity incentive compensation instrument for
employees. The Company also has an employee stock purchase plan for
all eligible employees. Effective April 1, 2006, the Company adopted
FASB Statement of Financial Accounting Standards (“SFAS”) No. 123R (revised
2004), Share-Based Payment
(SFAS No. 123R). SFAS No. 123R requires all
share-based payments to employees, including grants of employee stock options,
RSUs, and employee stock purchase rights, to be recognized in the financial
statements based on their respective grant date fair values and does not
allow
the previously permitted pro forma disclosure-only method as an alternative
to
financial statement recognition. SFAS No. 123R supersedes
Accounting Principles Board Opinion No. 25, Accounting for
Stock Issued to Employees (APB 25) and related
interpretations, and amends SFAS No. 95, Statement of
Cash Flows. SFAS No. 123R also requires the benefits
of tax deductions in excess of recognized compensation cost be reported as
a
financing cash flow, rather than as an operating cash flow as required
under
F-8
previous
literature. This requirement has reduced the Company’s net operating
cash flows and increased net financing cash flows. In March 2005, the
SEC issued SAB No. 107, Share-Based
Payment (SAB 107), which provides guidance regarding the
interaction of SFAS No. 123R and certain SEC rules and
regulations. The Company has applied the provisions of SAB 107
in its adoption of SFAS No. 123R.
The
Company adopted SFAS No. 123R using the modified-prospective method of
recognition of compensation expense related to share-based payments. The
Company’s consolidated statement of income for the twelve months ended March 31,
2007 reflects the impact of adopting SFAS No. 123R. In
accordance with the modified-prospective transition method, the Company’s
consolidated statements of income for prior periods have not been restated
to
reflect, and do not include, the impact of SFAS No. 123R.
SFAS No. 123R
requires companies to estimate the fair value of share-based payment awards
on
the date of grant using an option pricing model. The value of the portion
of the
award that is ultimately expected to vest is recognized as expense ratably
over
the requisite service periods. The Company has estimated the fair
value of each award as of the date of grant using the Black-Scholes option
pricing model, which was developed for use in estimating the value of traded
options that have no vesting restrictions and that are freely
transferable. The Black-Scholes model considers, among other factors,
the expected life of the award and the expected volatility of the Company’s
stock price. Although the Black-Scholes model meets the requirements
of SFAS No. 123R and SAB 107, the fair values generated by the
model may not be indicative of the actual fair values of the Company’s awards as
it does not consider other factors important to those share-based payment
awards
such as, continued employment, periodic vesting requirements, and limited
transferability.
Prior
to
the adoption of SFAS No. 123R, the Company presented all tax benefits of
deductions resulting from the exercise of stock options as operating cash
flows
in the condensed consolidated statements of cash flows. SFAS No. 123R
requires the cash flows resulting from the tax benefits arising from tax
deductions in excess of the compensation cost recognized for the equity
incentives (excess tax benefits) to be classified as financing cash
flows. The $22.8 million excess tax benefit classified as a financing
cash inflow in the Company’s accompanying consolidated statements of cash flows
for the twelve months ending March 31, 2007 would have been classified as
an
operating cash inflow if the Company had not adopted SFAS No. 123R.
Prior
to
the adoption of SFAS No. 123R, the Company accounted for share-based payment
awards to employees in accordance with APB 25 and related interpretations,
and had adopted the disclosure-only alternative of
SFAS No. 123, Accounting for Stock-Based
Compensation (“SFAS 123”), and
SFAS No. 148, Accounting for Stock-Based
Compensation — Transition and Disclosure. In accordance
with APB 25, share-based compensation expense was not recorded in
connection with share-based payment awards granted with exercise prices equal
to
or greater than the fair market value of the Company’s common stock on the date
of grant, unless certain modifications were subsequently made. The
Company recorded deferred compensation in connection with RSUs equal to the
fair
market value of the common stock on the date of grant. Recorded
deferred compensation was recognized as share-based compensation expense
ratably
over the applicable vesting periods. In accordance with the
provisions of SFAS No. 123R, all deferred compensation previously recorded
has
been eliminated with a corresponding reduction in additional paid-in
capital.
Determining
the appropriate fair-value model and calculating the fair value of share-based
awards at the date of grant requires judgment. The fair value of RSUs
is based on the fair market value of the Company’s common stock on the date of
grant discounted for expected future dividends. The Company uses the
Black-Scholes option pricing model to estimate the fair value of employee
stock
options and rights to purchase shares under stock participation plans,
consistent with the provisions of SFAS No. 123R. Option pricing
models, including the Black-Scholes model, also require the use of input
assumptions, including expected volatility, expected life, expected dividend
rate, and expected risk-free rate of return. The Company uses a blend
of historical and implied volatility based on options freely traded in the
open
market as it believes this is more reflective of market conditions and a
better
indicator of expected volatility than using purely historical
volatility. The expected life of the awards is based on historical
and other economic data trended into the future. The risk-free
interest rate assumption is based on observed interest rates appropriate
for the
terms of the Company’s awards. The dividend yield assumption is based
on the Company’s history and expectation of future dividend
payouts. SFAS No. 123R requires the Company to develop an estimate of
the number of share-based awards which will be forfeited due to employee
turnover. Quarterly changes in the estimated forfeiture rate may have
a significant effect on share-based compensation, as the effect of adjusting
the
rate for all expense amortization after April 1, 2006 is recognized in the
period the forfeiture estimate is changed. If the actual forfeiture
rate is higher than the estimated forfeiture rate, then an adjustment is
made to
increase the estimated forfeiture rate, which will result in a decrease to
the
expense recognized in the
F-9
financial
statements. If the actual forfeiture rate is lower than the estimated
forfeiture rate, then an adjustment is made to decrease the estimated forfeiture
rate, which will result in an increase to the expense recognized in the
financial statements. If forfeiture adjustments are made, they would
affect the Company’s results of operations. The effect of forfeiture
adjustments in the year ended March 31, 2007 was immaterial.
The
Company evaluates the assumptions used to value its awards on a quarterly
basis. If factors change and the Company employs different
assumptions, share-based compensation expense may differ significantly from
what
was recorded in the past. If there are any modifications or
cancellations of the underlying unvested securities, the Company may be required
to accelerate, increase or cancel any remaining unearned share-based
compensation expense. Future share-based compensation expense and
unearned share-based compensation will increase to the extent that the Company
grants additional equity awards to employees or it assumes unvested equity
awards in connection with acquisitions. Had the Company adopted SFAS
No. 123R in prior periods, the magnitude of the impact of that standard on
its
results of operations would have approximated the impact of SFAS 123
assuming the application of the Black-Scholes option pricing model as described
in the disclosure of pro forma net income and pro forma net income per share
in
Note 14 to the Company’s Consolidated Financial Statements.
Concentrations
of Credit Risk
Financial
instruments that potentially subject the Company to concentrations of credit
risk consist primarily of investments in debt securities and trade
receivables. The Company generally places its investments with
high-credit quality
counterparties. Investments in debt securities with original
maturities of greater than six months consist primarily of AAA rated financial
instruments and counterparties. The Company’s investments are
primarily in direct obligations of the United States government or its
agencies.
Concentrations
of credit risk with respect to accounts receivable are generally not significant
due to the diversity of the Company’s customers and geographic sales
areas. The Company had two distributors that accounted for 10% or
more of its net sales in the year ended March 31, 2007. The Company
sells its products primarily to OEMs and distributors in the Americas, Europe
and Asia. The Company performs ongoing credit evaluations of its
customers’ financial condition and requires collateral, primarily letters of
credit, as deemed necessary. No single end customer accounted for 10%
or more of the Company’s net sales or accounts receivable balances during the
years ended March 31, 2007, 2006 and 2005. See Note 16, Geographic
Information, for additional information on the Company’s largest
distributors.
Use
of Estimates
The
Company has made a number of estimates and assumptions relating to the reporting
of assets, liabilities, revenues and expenses and the disclosure of contingent
assets and liabilities to prepare the consolidated financial statements in
conformity with U.S. Generally Accepted Accounting Principles. Actual
results could differ from those estimates.
Recently
Issued Accounting Pronouncements
In
June
2006, the Financial Accounting Standards Board (FASB) issued Financial
Interpretation No. (FIN) 48, Accounting for Uncertainty in Income
Taxes, which clarifies the accounting for uncertainty in income taxes
recognized in an enterprise’s financial statements in accordance with FASB
Statement No. 109, Accounting for Income Taxes. The interpretation
prescribes a recognition threshold and measurement attribute for the financial
statement recognition and measurement of a tax position taken or expected
to be
taken in a tax return. FIN 48 is effective for fiscal years beginning after
December 15, 2006. The Company is reviewing its tax positions taken to determine
the effect, if any, that the adoption of this Interpretation will have on
its
results of operations or financial condition. However, the Company
does not expect the adoption of this Interpretation to have a material effect
on
the Company’s results of operations or financial conditions.
In
September 2006, the FASB issued SFAS No. 157, Fair Value Measurement
(SFAS No. 157). SFAS No. 157 defines fair value, establishes a
framework
for measuring fair value in accordance with generally accepted accounting
principles, and expands disclosures about fair value measurements, but does
not
require any new fair value measurement. SFAS No. 157 is effective for fiscal
years beginning after November 15, 2007 and interim periods within those
fiscal
years. The Company is in the process of determining the effect, if any, that
the
adoption of SFAS No. 157 will have on its consolidated financial statements.
Because Statement No. 157 does not require any new fair value measurements
or
re-measurements of previously computed fair values, management does not believe
F-10
On
February 15, 2007, the FASB issued SFAS No. 159, The Fair Value Option for
Financial Assets and Financial Liabilities (SFAS No. 159). Under this
Standard, the Company may elect to report financial instruments and certain
other items at fair value on a contract-by-contract basis with changes in
value
reported in earnings. This election is irrevocable. SFAS No. 159 provides
an
opportunity to mitigate volatility in reported earnings that is caused by
measuring hedged assets and liabilities that were previously required to
use a
different accounting method than the related hedging contracts when the complex
provisions of SFAS No. 133 hedge accounting are not met. SFAS No. 159 is
effective for years beginning after November 15, 2007. Early adoption within
120
days of the beginning of the Company’s 2008 fiscal year is permissible, provided
the Company has not yet issued interim financial statements for 2008 and
has
adopted SFAS No. 157. The Company is currently evaluating the potential impact
of adopting this Standard.
|
2.
|
SPECIAL
CHARGES
|
Settlement
with U.S. Philips Corporation
In
fiscal
2005, the Company reached an agreement with U.S. Philips Corporation and
Philips
Electronics North America Corp. (together “Philips”) regarding patent license
litigation. The agreement included dismissal of the then pending
litigation and the cross-license of certain patents between Philips and the
Company. The Company recorded a special charge of $21.1 million in
the quarter that ended June 30, 2004 associated with this
matter. Pursuant to this cross-license, the Company licensed certain
of its patents related to 8-pin microcontrollers to Philips, and Philips
licensed its patents related to I2C serial
communications to the Company, each on fully-paid up, non-royalty bearing
worldwide licenses. The Company finalized and executed the definitive
settlement agreement related to this matter and made the cash payment to
Philips
during the fiscal quarter ending September 30, 2004.
There
were no special charges in fiscal 2006 or 2007.
|
3.
|
INVESTMENTS
|
The
Company’s investments are intended to establish a high-quality portfolio that
preserves principal, meets liquidity needs, avoids inappropriate concentrations
and delivers an appropriate yield in relationship to the Company’s investment
guidelines and market conditions. The following is a summary of
available-for-sale securities at March 31, 2007 (amounts in
thousands):
|
Adjusted
Cost
|
Gross
Unrealized
Gains
|
Gross
Unrealized
Losses
|
Estimated
Fair
Value
|
|||||||||||||
|
State
student loan bonds
|
$ |
20,000
|
$ |
---
|
$ |
---
|
$ |
20,000
|
||||||||
|
Government
agency bonds
|
743,278
|
---
|
8,067
|
735,211
|
||||||||||||
|
Municipal
bonds
|
20,675
|
---
|
---
|
20,675
|
||||||||||||
|
Commercial
paper
|
25,000
|
---
|
26
|
24,974
|
||||||||||||
|
Floating
rate securities
|
310,710
|
---
|
660
|
310,050
|
||||||||||||
| $ |
1,119,663
|
$ |
---
|
$ |
8,753
|
$ |
1,110,910
|
|||||||||
At
March
31, 2007, the Company evaluated its investment portfolio, and noted unrealized
losses of $8.8 million were due to fluctuations in interest
rates. Management does not believe any of the unrealized losses
represented an other-than-temporary impairment based on its evaluation of
available evidence as of March 31, 2007. The Company’s intent is to
hold these investments to such time as these assets are no longer
impaired. For those investments not scheduled to mature until after
March 31, 2008, such recovery is not anticipated to occur in the next year
and
these investments have been classified as long-term investments. At
March 31, 2007, short-term investments consist of $583.0 million and long-term
investments consist of $527.9 million.
The
amortized cost and estimated fair value of the available-for-sale securities
at
March 31, 2007, by maturity, are shown below (amounts in
thousands). Expected maturities can differ from contractual
maturities because the issuers of the securities may have the right to prepay
obligations without prepayment penalties, and the Company views its
available-for-sale securities as available for current
operations.
F-11
|
Adjusted
Cost
|
Gross
Unrealized Gains
|
Gross
Unrealized Losses
|
Estimated
Fair
Value
|
|||||||||||||
|
Available-for-sale
|
||||||||||||||||
|
Due
in one year or less
|
$ |
502,305
|
$ |
---
|
$ |
1,263
|
$ |
501,042
|
||||||||
|
Due
after one year and through five years
|
617,358
|
---
|
7,490
|
609,868
|
||||||||||||
| $ |
1,119,663
|
$ |
---
|
$ |
8,753
|
$ |
1,110,910
|
|||||||||
The
following is a summary of available-for-sale securities at March 31, 2006
(amounts in thousands):
|
Adjusted
Cost
|
Gross
Unrealized Gains
|
Gross
Unrealized Losses
|
Estimated
Fair
Value
|
|||||||||||||
|
State
student loan bonds
|
$ |
34,600
|
$ |
---
|
$ |
---
|
$ |
34,600
|
||||||||
|
Government
agency bonds
|
616,317
|
---
|
16,644
|
599,673
|
||||||||||||
|
Municipal
bonds
|
2,583
|
---
|
5
|
2,578
|
||||||||||||
|
Floating
rate securities
|
83,075
|
---
|
75
|
83,000
|
||||||||||||
| $ |
736,575
|
$ |
---
|
$ |
16,724
|
$ |
719,851
|
|||||||||
At
March
31, 2006, short-term investments consist of $199.5 million and long-term
investments consist of $520.4 million.
During
the year ended March 31, 2007 and March 31, 2005, the Company did not have
any
gross realized gains or losses on sales of available-for-sale
securities. During the year ended March 31, 2006, the Company had
gross realized losses on available-for-sale securities of eight thousand
dollars.
4. ACCOUNTS
RECEIVABLE
Accounts
receivable consists of the following (amounts in thousands):
|
March
31,
|
||||||||
|
2007
|
2006
|
|||||||
|
Trade
accounts receivable
|
$ |
127,467
|
$ |
142,703
|
||||
|
Other
|
636
|
320
|
||||||
|
128,103
|
143,023
|
|||||||
|
Less
allowance for doubtful accounts
|
3,544
|
3,662
|
||||||
| $ |
124,559
|
$ |
139,361
|
|||||
5. INVENTORIES
Inventories
consist of the following (amounts in thousands):
|
March
31,
|
||||||||
|
2007
|
2006
|
|||||||
|
Raw
materials
|
$ |
5,118
|
$ |
3,505
|
||||
|
Work
in process
|
83,783
|
80,947
|
||||||
|
Finished
goods
|
32,123
|
30,572
|
||||||
| $ |
121,024
|
$ |
115,024
|
|||||
Inventory
impairment charges establish a new cost basis for inventory and charges are
not
subsequently reversed to income even if circumstances later suggest that
increased carrying amounts are recoverable.
F-12
6. PROPERTY,
PLANT AND EQUIPMENT
Property,
plant and equipment consists of the following (amounts in
thousands):
|
March
31,
|
||||||||
|
2007
|
2006
|
|||||||
|
Land
|
$ |
47,212
|
$ |
47,212
|
||||
|
Building
and building improvements
|
372,149
|
366,055
|
||||||
|
Machinery
and equipment
|
1,059,565
|
991,452
|
||||||
|
Projects
in process
|
69,040
|
87,341
|
||||||
|
1,547,966
|
1,492,060
|
|||||||
|
Less
accumulated depreciation and amortization
|
942,244
|
832,088
|
||||||
| $ |
605,722
|
$ |
659,972
|
|||||
Depreciation
and amortization expense attributed to property, plant and equipment was
$114.3
million, $109.3 million and $119.0 million for the years ending March 31,
2007, 2006 and 2005, respectively.
7. INTANGIBLE
ASSETS
Intangible
assets consist of the following (amounts in thousands):
|
March
31, 2007
|
||||||||||||
|
Gross
Amount
|
Accumulated
Amortization
|
Net
Amount
|
||||||||||
|
Developed
technology
|
$ |
16,571
|
$ | (11,242 | ) | $ |
5,329
|
|||||
|
Distribution
rights
|
5,236
|
(2,109 | ) |
3,127
|
||||||||
| $ |
21,807
|
$ | (13,351 | ) | $ |
8,456
|
||||||
|
March
31, 2006
|
||||||||||||
|
Gross
Amount
|
Accumulated
Amortization
|
Net
Amount
|
||||||||||
|
Developed
technology
|
$ |
15,729
|
$ | (9,864 | ) | $ |
5,865
|
|||||
|
Distribution
rights
|
5,236
|
(1,612 | ) |
3,624
|
||||||||
| $ |
20,965
|
$ | (11,746 | ) | $ |
9,489
|
||||||
The
Company amortizes intangible assets over their expected useful lives, which
range between 1 and 10 years. In fiscal 2007, the Company acquired $0.8 million
of developed technology, which has a weighted average amortization period
of 9.5
years. The following is an expected amortization schedule for the
intangible assets for the fiscal years March 31, 2008 through March 31, 2012,
absent any future acquisitions or impairment charges (amounts in
thousands):
|
Year
Ending
March
31,
|
Projected
Amortization
Expense
|
|
2008
|
$1,788
|
|
2009
|
2,330
|
|
2010
|
1,340
|
|
2011
|
924
|
|
2012
|
902
|
The
Company has not recorded any impairment losses associated with the intangible
assets acquired.
8. SHORT-TERM
DEBT
The
Company had no short-term debt at March 31, 2007. The Company had
short-term debt of $269.0 million at March 31, 2006. The short-term debt
was a
result of repurchase agreements that were in place with two investment
brokerages. The short-term debt was collateralized with $277.6 million of
available-for-sale investments at March 31, 2006 and had a weighted average
interest rate of 4.83%. In fiscal 2006, the borrowings were made to
complete a $500 million repatriation of foreign earnings under the American
Jobs
Creation Act. The borrowings were collateralized against investments that
are held by the Company’s offshore subsidiaries. During fiscal 2007,
the entire $269.0 million of short-term borrowings were paid
down. There were no covenants associated with the repurchase
agreements.
F-13
9. ACCRUED
LIABILITIES
Accrued
liabilities consist of the following (amounts in thousands):
|
March
31,
|
||||||||
|
2007
|
2006
|
|||||||
|
Income
taxes
|
$ |
84,432
|
$ |
144,838
|
||||
|
Other
accrued expenses
|
45,450
|
44,849
|
||||||
| $ |
129,882
|
$ |
189,687
|
|||||
10. INCOME
TAXES
|
|
The
provision for income taxes consists of the following (amounts in
thousands):
|
|
Year
Ended March 31,
|
||||||||||||
|
2007
|
2006
|
2005
|
||||||||||
|
Current
expense:
|
||||||||||||
|
Federal
|
$ |
24,334
|
$ |
79,082
|
$ |
34,320
|
||||||
|
State
|
2,437
|
5,837
|
3,436
|
|||||||||
|
Foreign
|
8,267
|
14,381
|
8,858
|
|||||||||
|
Total
current
|
35,038
|
99,300
|
46,614
|
|||||||||
|
Deferred
expense (benefit):
|
||||||||||||
|
Federal
|
10,005
|
16,165
|
5,908
|
|||||||||
|
State
|
1,001
|
1,618
|
591
|
|||||||||
|
Foreign
|
(1,983 | ) | (267 | ) |
10,370
|
|||||||
|
Total
deferred
|
9,023
|
17,516
|
16,869
|
|||||||||
| $ |
44,061
|
$ |
116,816
|
$ |
63,483
|
|||||||
The
tax
benefit associated with the exercise of employee stock options reduced taxes
currently payable by $22.9 million, $29.4 million and $15.3 million
for the years ended March 31, 2007, 2006 and 2005,
respectively. These amounts were credited to additional paid-in
capital in each of the three fiscal years.
The
provision for income taxes differs from the amount computed by applying the
statutory federal tax rate to income before income taxes. The sources
and tax effects of the differences in the total income tax provision are
as
follows (amounts in thousands):
|
Year
Ended March 31,
|
||||||||||||
|
2007
|
2006
|
2005
|
||||||||||
|
Computed
expected income tax provision
|
$ |
140,382
|
$ |
125,715
|
$ |
97,044
|
||||||
|
State
income taxes, net of federal benefits
|
5,103
|
3,548
|
2,738
|
|||||||||
|
Foreign
export sales benefit
|
(658 | ) | (2,600 | ) | (1,111 | ) | ||||||
|
Research
and development tax credits
|
(3,573 | ) | (2,095 | ) | (4,750 | ) | ||||||
|
Foreign
income taxed at lower than the federal rate
|
(44,993 | ) | (38,362 | ) | (30,438 | ) | ||||||
|
Tax
benefit from IRS settlement
|
(52,200 | ) |
---
|
---
|
||||||||
|
Repatriation
of foreign earnings
|
---
|
30,610
|
---
|
|||||||||
| $ |
44,061
|
$ |
116,816
|
$ |
63,483
|
|||||||
Pretax
income from foreign operations was $255.3 million, $257.8 million and
$199.0 million for the years ended March 31, 2007, 2006 and 2005,
respectively. Unremitted foreign earnings that are considered to be
permanently invested outside the United States, and on which no deferred
taxes
have been provided, amounted to approximately $708.7 million at March 31,
2007. Should the Company elect in the future to repatriate a portion
of the foreign earnings so invested, the Company would incur income tax expense
on such repatriation, net of any available
deductions and foreign tax credits. This would result in additional
income tax expense beyond the computed expected provision in such
periods.
F-14
During
year ended March 31, 2007, the Company completed a settlement agreement with
the
United States Internal Revenue Service (“IRS”) for its fiscal years ended March
31, 1998, 1999, 2000 and 2001. As part of this settlement the Company
recognized $52.2 million as a tax benefit in March 2007 related to amounts
previously accrued for the issues that were in dispute with the
IRS. This tax benefit decreased the Company’s effective tax rate for
fiscal 2007 by approximately 13.0 percentage points, to 11.0%. This
decrease is reflected as a separate line in the rate reconciliation table
above.
The
American Jobs Creation Act of 2004 (the “Jobs Act”) created a temporary
incentive for U.S. corporations to repatriate accumulated income earned abroad
by providing an 85% dividends-received deduction for certain dividends from
controlled non-U.S. corporations. During fiscal 2006, the Company’s
Chief Executive Officer approved a domestic reinvestment plan, under which
the
Company repatriated $500 million in earnings outside the U.S. pursuant to
the Jobs Act. The Company recorded additional tax expense in fiscal
2006 of approximately $30.6 million ($0.14 per diluted common share)
related to this decision to repatriate non-U.S. earnings. This
repatriation increased the Company’s effective rate for fiscal 2006 by
approximately 8.5 percentage points, to 32.5%. This increase is
reflected as a separate line item in the rate reconciliation table
above.
The
tax
effects of temporary differences that give rise to significant portions of
the
deferred tax assets and deferred tax liabilities are as follows (amounts
in
thousands):
|
March
31,
|
||||||||
|
2007
|
2006
|
|||||||
|
Deferred
tax assets:
|
||||||||
|
Deferred
intercompany
profit
|
$ |
8,089
|
$ |
8,266
|
||||
|
Deferred
income on shipments to
distributors
|
22,732
|
21,325
|
||||||
|
Inventory
valuation
|
1,490
|
1,970
|
||||||
|
Net
operating loss
carryforward
|
3,890
|
4,916
|
||||||
|
Share-based
compensation
|
9,344
|
---
|
||||||
|
Tax
credit
carryforward
|
6,814
|
31,708
|
||||||
|
Accrued
expenses and
other
|
9,624
|
10,359
|
||||||
|
Gross
deferred tax
assets
|
61,983
|
78,544
|
||||||
|
Deferred
tax liabilities:
|
||||||||
|
Property,
plant and equipment,
principally
due
to differences in
depreciation
|
(7,615 | ) | (13,655 | ) | ||||
|
Other
|
(712 | ) | (982 | ) | ||||
|
Gross
deferred tax
liability
|
(8,327 | ) | (14,637 | ) | ||||
|
Net
deferred tax
asset
|
$ |
53,656
|
$ |
63,907
|
||||
Management
believes that the Company’s results of future operations will generate
sufficient taxable income such that it is “more likely than not” that the
deferred tax assets will be realized.
At
March
31, 2007, the Company had a net operating loss carryforward for federal income
tax purposes of approximately $10.1 million, which begins to expire in
varying amounts in the years 2020 through
2022. The net operating loss carryforward is attributable to the
acquisition of PowerSmart in fiscal 2003. An analysis of the annual
limitation on the utilization of the PowerSmart net operating losses was
performed in accordance with Internal Revenue Code Section 382. It
was determined that Section 382 will not limit the use of the PowerSmart
net
operating losses in full over the carryover period.
At
March
31, 2007, the Company had recorded credit carryforwards of approximately
$6.8 million for foreign tax credits. The foreign tax credits
begin to expire in varying amounts in the years ending March 31, 2014 through
March 31, 2017. The Company believes that all of its credit
carryforwards will be utilized in future periods.
The
Company’s Thailand manufacturing operations currently benefit from numerous tax
holidays granted to the Company based on its investment in property, plant
and
equipment in Thailand. The Company’s tax holiday periods in Thailand
expire at various times in the future. The Company does not expect
the future expiration of any of its tax holiday periods in Thailand to have
a
material impact on its effective tax rate. The aggregate dollar
benefits
F-15
derived
from these tax holidays approximated $6.1 million, $7.9 million and
$11.5 million for the years ended March 31, 2007, 2006 and 2005,
respectively. The benefit the tax holiday had on net income per share
approximated $0.03, $0.04 and $0.05 for the years ended March 31, 2007, 2006
and
2005, respectively.
The
Company recognizes liabilities for anticipated tax audit issues in the United
States and other tax jurisdictions based on its estimate of whether, and
the
extent to which, additional tax payments are probable. The Company
believes that it maintains adequate tax reserves to offset any potential
tax
liabilities that may arise upon final resolution of matters for open tax
years. The IRS is currently auditing the Company’s fiscal years ended
March 31, 2002, 2003 and 2004. The Company believes that it maintains
adequate tax reserves to offset any potential tax liabilities that may arise
upon these and other pending audits in the United States and other countries
in
which it does business. If such amounts ultimately prove to be
unnecessary, the resulting reversal of such reserves would result in tax
benefits being recorded in the period the reserves are no longer deemed
necessary. If such amounts ultimately prove to be less than an
ultimate assessment, a future charge to expense would be recorded in the
period
in which the assessment is determined.
|
11.
|
CONTINGENCIES
|
The
Company’s assembly and test facility in Thailand is located in Alphatechnopolis
Industrial Park near Bangkok on land to which the Company expects to acquire
title in accordance with its agreement with the landowner. Progress
towards obtaining full title of the land has been delayed due to a bankruptcy
relating to the seller of the land. The Company is currently working
with the creditors in an attempt to reach resolution on this
matter. At this time it is not possible to estimate when, or if,
transfer of full title will be completed. The Company has provided
reserves that it estimates will be adequate to obtain full
title. Such reserves are set at the estimated fair value of the
land.
In
the
ordinary course of its business, the Company is involved in a limited number
of
legal actions, both as plaintiff and defendant, and could incur uninsured
liability in any one or more of them. Litigation relating to the
semiconductor industry is not uncommon, and the Company is, and from time
to
time has been, subject to such litigation. In the Company’s opinion,
based on consultation with legal counsel, as of March 31, 2007, the effect
of
such matters will not have a material adverse effect on the Company’s financial
position, cash flows or results of operations.
|
12.
|
STOCKHOLDERS’
EQUITY
|
Stockholder
Rights Plan. Effective October 11, 1999, the Company adopted an
Amended and Restated Preferred Shares Rights Agreement as amended on January
29,
2007 (the “Amended Rights Agreement”). The Amended Rights Agreement
amends and restates the Preferred Share Rights Agreement adopted by the Company
as of February 13, 1995 (the “Prior Rights Agreement”). Under the
Prior Rights Agreement, on February 13, 1995, the Company’s Board of Directors
declared a dividend of one right (a “Right”) to purchase one one-hundredth of a
share of the Company’s Series A Participating Preferred Stock (“Series A
Preferred”) for each outstanding share of common stock, $.001 par value, of the
Company. The dividend was payable on February 24, 1995 to
stockholders of record as of the close of business on that date. The
Amended Rights Agreement supersedes the Prior Rights Agreement as originally
executed. Under the Amended Rights Agreement, each Right enables the
holder to purchase from the Company one one-hundredth of a share of Series
A
Preferred at a purchase price of seventy four dollars and seven cents ($74.07)
(the “Purchase Price”), subject to adjustment. Under the Amended
Rights Agreement, the rights will become exercisable upon the earlier of
(i) 10
days following a public announcement that a person or a group of affiliated
or
associated persons has acquired, or obtained the right to acquire, beneficial
ownership of 18% or more of the Company’s outstanding common shares, or (ii) 10
days (or such later date as may be determined by action of the Company’s Board
of Directors) following the commencement of, or announcement of an intention
to
make, a tender offer or exchange offer the consummation of which would result
in
a beneficial ownership by a person or group of 18% or more of the Company’s
outstanding common shares.
Stock
Repurchase Activity. On April 22, 2004, the Company’s Board of
Directors authorized the repurchase of an additional 2,500,000 shares of
its
common stock in the open market or in privately negotiated
transactions. As of March 31, 2007, the Company had repurchased
1,004,834 shares under this authorization for $26.6 million. As of
March 31, 2007, all of the purchased shares under the authorizations had
been
reissued to fund stock option exercises and purchases under the Company’s
employee stock purchase plan. On October 25, 2006, the Company
announced that its Board of Directors had authorized the repurchase of up
to an
additional 10 million shares of its common stock in the open market or in
privately negotiated transactions. The timing and amount of
future
F-16
repurchases
will depend upon market conditions, interest rates and corporate
considerations. During the year ended March 31, 2007, the Company did
not repurchase any of its shares of common stock. During the year
ended March 31, 2006, the Company purchased 119,934 shares of its common
stock for $3.3 million. During the year ended March 31, 2005, the
Company purchased 2,184,800 shares of its common stock for
$57.7 million.
|
13.
|
EMPLOYEE
BENEFIT PLANS
|
The
Company maintains a contributory profit-sharing plan for its domestic employees
meeting certain eligibility and service requirements. The plan
qualifies under Section 401(k) of the Internal Revenue Code of 1986, as amended,
and allows employees to contribute up to 60% of their base salary, subject
to
maximum annual limitations prescribed by the Internal Revenue
Service. The Company shall make a matching contribution of up to 25%
of the first 4% of the participant’s eligible compensation and may award up to
an additional 25% under the discretionary match. All matches are
provided on a quarterly basis and require the participant to be an active
employee at the end of each quarter. For the fiscal years ended March
31, 2007, 2006 and 2005, the Company contributions to the plan totaled
$1.7 million, $1.5 million and $1.4 million,
respectively.
The
Company’s 2001 Employee Stock Purchase Plan (the “2001 Purchase Plan”) became
effective on March 1, 2002. The Board of Directors approved the 2001
Purchase Plan in May 2001 and the stockholders approved it in August
2001. Under the 2001 Purchase Plan, eligible employees of the Company
may purchase shares of common stock at semi-annual intervals through periodic
payroll deductions. The purchase price in general will be 85% of the
lower of the fair market value of the common stock on the first day of the
participant’s entry date into the offering period or 85% of the fair market
value on the semi-annual purchase date. Depending upon a
participant’s entry date into the 2001 Purchase Plan, purchase periods under the
2001 Purchase Plan consist of overlapping periods of either 24, 18, 12 or
6
months in duration. In May 2003 and August 2003, the Company’s Board
and stockholders, respectively, each approved an annual automatic increase
in
the number of shares reserved under the 2001 Purchase Plan. The
automatic increase took effect on January 1, 2005, and on each January 1
thereafter during the term of the plan, and is equal to the lesser of (i)
1,500,000 shares, (ii) one half of one percent (0.5%) of the then outstanding
shares of the Company’s common stock, or (iii) such lesser amount as is approved
by the Company’s Board of Directors. On January 1, 2007, 1,080,191
additional shares were reserved under the 2001 Purchase Plan based on the
automatic increase. On January 1, 2006, 1,058,541 additional shares
were reserved under the 2001 Purchase Plan based on the automatic
increase. On January 1, 2005, 1,035,863 additional shares were
reserved under the 2001 Purchase Plan based on the automatic
increase. Since the inception of the 2001 Purchase Plan, 6,599,595
shares of common stock have been reserved for issuance and 2,132,832 shares
have
been issued under this purchase plan.
During
fiscal 1995, a purchase plan was adopted for employees in non-U.S.
locations. Such plan allows for the purchase price per share to be
100% of the lower of the fair market value of the common stock at the beginning
or end of the semi-annual purchase plan period. Effective May 1,
2006, the Company’s Board approved a purchase price per share equal to
eighty-five percent (85%) of the lower of the fair market value of the common
stock at the beginning or end of the semi-annual purchase plan
period. Since the inception of this purchase plan, 564,632 shares of
common stock have been reserved for issuance and 271,512 shares have been
issued
under this purchase plan.
Effective
January 1, 1997, the Company adopted a non-qualified deferred compensation
arrangement. This plan is unfunded and is maintained primarily for
the purpose of providing deferred compensation for a select group of highly
compensated employees as defined in ERISA Sections 201, 301 and
401. There are no Company matching contributions made under this
plan.
The
Company has management incentive compensation plans which provides for bonus
payments, based on a percentage of base salary, from an incentive pool created
from operating profits of the Company, at the discretion of the Board of
Directors. During the years ended March 31, 2007, 2006 and 2005,
$12.4 million, $14.1 million and $10.2 million were charged against
operations for this plan, respectively.
The
Company also has a plan that, at the discretion of the Board of Directors,
provides a cash bonus to all employees of the Company based on the operating
profits of the Company. During the years ended March 31, 2007, 2006
and 2005, $6.2 million, $9.4 million and $4.9 million, respectively, were
charged against operations for this plan.
F-17
|
14.
|
EQUITY
INCENTIVE PLANS
|
The
Company has equity incentive plans under which incentive stock options,
restricted stock units (“RSUs”) and non-qualified stock options have been
granted to employees and under which non-qualified stock options have been
granted to non-employee members of the Board of Directors. The
Company’s 2004 Equity Incentive Plan, as amended and restated (the “2004 Plan”),
is shareholder approved and permits the grant of stock options and RSUs to
employees, non-employee members of the Board of Directors and
consultants. At March 31, 2007, 12.1 million shares remained
available for future grant under the 2004 Plan. Stock options and
RSUs are designed to reward employees for their long-term contributions to
the
Company and to provide incentive for them to remain employed with the
Company. The Company believes that such awards better align the
interests of its employees with those of its shareholders.
The
Board
of Directors or the plan administrator determines eligibility, vesting schedules
and exercise prices for equity incentives granted under the
plans. Stock options granted generally have a term of 10 years.
Equity incentives granted in the case of newly hired employees generally
vest
and become exercisable at the rate of 25% after one year of service and ratably
on a monthly or quarterly basis over a period of 36 months
thereafter. Subsequent equity incentive grants to existing employees
generally vest and become exercisable ratably on a monthly or quarterly basis
over a period starting in 48 months and ending in 60 months after the date
of
grant. Historically, the Company has gone through its equity
compensation grant process during the first two weeks of April each
year.
Under
the
plans, 105,929,741 shares of common stock had been reserved for issuance
since
the inception of the plans.
Share-Based
Compensation Expense
The
following table presents details of share-based compensation expense resulting
from the application of SFAS NO. 123R (amounts in thousands):
|
Year
Ended
March
31,
|
||||||||
|
2007(1)
|
2006
|
|||||||
|
Cost
of sales
|
$ | 3,255 | (2) | $ |
---
|
|||
|
Research
and development
|
9,623
|
214
|
||||||
|
Selling,
general and administrative
|
14,501
|
364
|
||||||
|
Pre-tax
effect of share-based compensation
|
27,379
|
578
|
||||||
|
Income
tax benefit
|
6,570
|
139
|
||||||
|
Net
income effect of share-based compensation
|
$ |
20,809
|
$ |
439
|
||||
|
Effect
on net income per common share – basic and diluted
|
$ |
0.09
|
$ |
---
|
||||
(1)
The
amounts included in the twelve months ended March 31, 2007 reflect the adoption
of SFAS No. 123R. In accordance with the modified prospective method
of transition, the Company’s consolidated statements of income for prior periods
have not been restated to reflect, and do not include, the impact of SFAS
No.
123R.
(2)
During the twelve months ended March 31, 2007,
$6.6 million was capitalized to inventory, of which $3.3
million was sold.
The
amount of unearned share-based compensation currently estimated to be expensed
in fiscal 2008 through fiscal 2012 related to unvested share-based payment
awards at March 31, 2007 is $65.7 million. The weighted average
period over which the unearned share-based compensation is expected to be
recognized is approximately 2.72 years.
In
accordance with the requirements of the disclosure-only alternative of SFAS
No.
123, set forth below is a pro forma illustration of the effect on net income
and
net income per share computed as if the Company had valued share-based awards
to
employees using the Black-Scholes option pricing model instead of applying
the
guidelines provided by APB 25 for the fiscal years ended March 31, 2006 and
2005
(in thousands, except per share amounts):
F-18
|
Year
Ended March 31,
|
||||||||
|
2006
|
2005
|
|||||||
|
Net
income, as reported
|
$ |
242,369
|
$ |
213,785
|
||||
|
Deduct: Total
share-based employee compensation expense determined under fair
value
methods for all awards, net of related tax effects.
|
16,240
|
37,211
|
||||||
|
Pro
forma net income
|
$ |
226,129
|
$ |
176,574
|
||||
|
Net
income per common share:
|
||||||||
|
Basic,
as reported
|
$ |
1.15
|
$ |
1.03
|
||||
|
Basic,
pro forma
|
$ |
1.08
|
$ |
0.85
|
||||
|
Diluted,
as
reported
|
$ |
1.13
|
$ |
1.01
|
||||
|
Diluted,
pro forma
|
$ |
1.05
|
$ |
0.83
|
||||
At
a
meeting held on February 17, 2005, the Compensation Committee of the Board
of
Directors and the Board of Directors of the Company approved the acceleration
of
the vesting of certain Company stock options with an option price of $27.153
per
share or greater. The purpose of the accelerated vesting was to
enable the Company to avoid recognizing in its income statement compensation
expense associated with these options in future periods, upon adoption of
SFAS
No. 123R on April 1, 2006. The pre-tax charge that was avoided
amounted to approximately $13.7 million and represented the fair value of
the
unvested awards as of the date of the acceleration as determined under SFAS
No.
123. This amount would otherwise have been required to be recognized
as compensation expense over the vesting period upon adoption of SFAS No.
123R. As a result of the accelerated vesting, approximately 2.3
million option shares or 25.4% of the total number of the outstanding unvested
option shares as of the date of the acceleration with varying remaining vesting
schedules became immediately exercisable. In connection with the
vesting acceleration, the Company required that any shares received through
the
exercise of the accelerated options not be sold by the option holder until
the
first to occur of the original vesting date of the accelerated option or
the
termination of the employment of the option holder. On April 25,
2006, in order to alleviate administrative burdens, the Company waived this
requirement as to approximately 1.0 million option shares held by those
employees who are not executive officers, appointed officers or director-level
employees of the Company. As of the date of the acceleration, the
fair market value of the Company’s common stock was below the option price of
the accelerated options in all material respects, so no APB No. 25 charges
were
incurred and future potential charges are immaterial.
Combined
Incentive Plan Information
RSU
share activity under the 2004 Plan
is set forth below:
|
Number
of Shares
|
||||
|
Nonvested
shares at March 31, 2005
|
0
|
|||
|
Granted
|
203,334
|
|||
|
Canceled
|
(3,083 | ) | ||
|
Vested
|
(4,727 | ) | ||
|
Nonvested
shares at March 31, 2006
|
195,524
|
|||
|
Granted
|
1,634,393
|
|||
|
Canceled
|
(99,380 | ) | ||
|
Vested
|
(43,094 | ) | ||
|
Nonvested
shares at March 31, 2007
|
1,687,443
|
|||
The
total
pre-tax intrinsic value of RSUs which vested during the twelve months ended
March 31, 2007 was $1.4 million. The aggregate pre-tax intrinsic
value of RSUs outstanding at March 31, 2007 was $59.8 million calculated
based
on the closing price of the Company’s common stock of $35.53 on March 30,
2007. At March 31, 2007, the weighted average remaining expense
recognition period was 3.28 years. The weighted average fair values
per share of the RSUs awarded in the twelve months ended March 31, 2007 was
$31.37, calculated based on the fair market value of the Company’s common stock
on the respective grant dates discounted for the Company’s
expected
F-19
dividend
yield. The weighted average fair values per share of RSUs awarded in
the twelve months ended March 31, 2006 was $31.36, calculated based on the
intrinsic value on the date of grant.
Option
activity under the Company’s stock incentive plans in the three years ended
March 31, 2007 is set forth below:
|
Number
of
Shares
|
Weighted
Average
Exercise
Price
per Share
|
|||||||
|
Outstanding
at March 31, 2004
|
23,359,928
|
$ |
17.60
|
|||||
|
Granted
|
2,693,824
|
27.35
|
||||||
|
Exercised
|
(2,881,830 | ) |
12.78
|
|||||
|
Canceled
|
(801,236 | ) |
23.34
|
|||||
|
Outstanding
at March 31, 2005
|
22,370,686
|
19.19
|
||||||
|
Granted
|
2,204,099
|
25.91
|
||||||
|
Exercised
|
(5,561,188 | ) |
15.46
|
|||||
|
Canceled
|
(563,237 | ) |
23.81
|
|||||
|
Outstanding
at March 31, 2006
|
18,450,360
|
20.97
|
||||||
|
Granted
|
59,452
|
34.58
|
||||||
|
Exercised
|
(3,393,779 | ) |
16.87
|
|||||
|
Canceled
|
(375,487 | ) |
24.25
|
|||||
|
Outstanding
at March 31, 2007
|
14,740,546
|
$ |
21.88
|
|||||
The
total
pre-tax intrinsic value of options exercised during the twelve months ended
March 31, 2007, 2006, and 2005 was $61.8 million, $90.3 million
and $42.4 million, respectively. This intrinsic value represents
the difference between the fair market value of the Company’s common stock on
the date of exercise and the exercise price of each equity award.
The
following table summarizes information about the stock options outstanding
at
March 31, 2007:
|
Range
of
Exercise Prices
|
Number
Outstanding
|
Weighted
Average
Exercise
Price
|
Weighted
Average
Remaining
Life
(in
years)
|
Number
Exercisable
|
Weighted
Average
Exercise
Price
|
|||||
|
$
1.82 – $10.04
|
1,752,072
|
$8.64
|
1.68
|
1,751,287
|
$ 8.65
|
|||||
|
10.05 – 15.92
|
1,419,625
|
15.65
|
3.84
|
1,419,625
|
15.65
|
|||||
|
15.93 – 18.48
|
1,897,953
|
18.41
|
5.81
|
612,323
|
18.25
|
|||||
|
18.49 – 23.39
|
1,821,964
|
22.37
|
3.53
|
1,816,042
|
22.37
|
|||||
|
23.40 – 25.26
|
955,979
|
24.20
|
5.11
|
952,718
|
24.20
|
|||||
|
25.27 – 25.29
|
1,655,564
|
25.29
|
7.95
|
17,509
|
25.29
|
|||||
|
25.30 – 27.05
|
2,208,420
|
26.77
|
6.87
|
720,175
|
26.26
|
|||||
|
27.06 – 27.15
|
1,823,651
|
27.15
|
4.98
|
1,823,651
|
27.15
|
|||||
|
27.16 – 36.10
|
1,173,270
|
29.58
|
6.33
|
845,096
|
29.48
|
|||||
|
36.11 – 37.06
|
32,048
|
37.06
|
9.01
|
---
|
---
|
|||||
|
|
14,740,546
|
$21.88
|
5.15
|
9,958,426
|
$20.69
|
The
aggregate pre-tax intrinsic value of options outstanding and options exercisable
at March 31, 2007 was $201.2 million and $147.8 million,
respectively. The aggregate pre-tax intrinsic values were calculated
based on the closing price of the Company’s common stock of $35.53 on March 30,
2007.
At
March
31, 2007 and 2006, the number of option shares exercisable was 9,958,426
and
12,762,774, respectively, and the weighted average exercise price of these
options was $20.69 and $19.39, respectively.
F-20
The
weighted average
fair values per share of stock options granted in the twelve months ended
March 31, 2007, 2006, and 2005 was $11.90, $9.89, and $15.82
respectively.
The
weighted average fair values per share of stock options granted in connection
with the Company’s stock incentive plans in the twelve months ended March 31,
2007, 2006, and 2005 were estimated utilizing the following
assumptions:
|
Year
ended March 31,
|
||||||||||||
|
2007
|
2006
|
2005
|
||||||||||
|
Expected
life (in years)
|
5.42
|
5.21
|
5.30
|
|||||||||
|
Volatility
|
42 | % | 44 | % | 67 | % | ||||||
|
Risk-free
interest rate
|
5.00 | % | 4.20 | % | 3.78 | % | ||||||
|
Dividend
yield
|
3.01 | % | 2.14 | % | 0.97 | % | ||||||
|
15.
|
LEASE
COMMITMENTS
|
The
Company leases office space, transportation and other equipment under operating
leases, which expire at various dates through March 31, 2012. The
future minimum lease commitments under these operating leases at March 31,
2007
are as follows (amounts in thousands):
|
Year
Ending March
31,
|
Amount
|
|||
|
2008
|
$ |
3,956
|
||
|
2009
|
3,260
|
|||
|
2010
|
1,867
|
|||
|
2011
|
1,545
|
|||
|
2012
|
949
|
|||
|
Total
minimum payments
|
$ |
11,577
|
||
Rental
expense under operating leases totaled $6.2 million, $6.8 million and $5.9
million for the years ended March 31, 2007, 2006 and 2005,
respectively.
|
16.
|
GEOGRAPHIC
INFORMATION
|
The
Company operates in one operating segment and engages primarily in the design,
development, manufacture and marketing of semiconductor products. The
Company sells its products to distributors and original equipment manufacturers
(OEMs) in a broad range of market segments, performs on-going credit evaluations
of its customers and generally requires no collateral. The Company’s
operations outside the United States consist of product assembly and final
test
facilities in Thailand, and sales and support centers and design centers
in
certain foreign countries. Domestic operations are responsible for
the design, development and wafer fabrication of all products, as well as
the
coordination of production planning and shipping to meet worldwide customer
commitments. The Thailand assembly and test facility is reimbursed in
relation to value added with respect to assembly and test operations and
other
functions performed, and certain foreign sales offices receive compensation
for
sales within their territory. Accordingly, for financial statement
purposes, it is not meaningful to segregate sales or operating profits for
the
assembly and test and foreign sales office operations. Identifiable
long-lived assets (consisting of property, plant and equipment, intangible
assets and goodwill) by geographic area are as follows (amounts in
thousands):
|
March
31,
|
||||||||
|
2007
|
2006
|
|||||||
|
United
States
|
$ |
524,950
|
$ |
576,859
|
||||
|
Thailand
|
114,560
|
117,975
|
||||||
|
Various
other countries
|
6,554
|
6,513
|
||||||
|
Total
long-lived assets
|
$ |
646,064
|
$ |
701,347
|
||||
F-21
Sales
to
unaffiliated customers located outside the United States, primarily in Asia
and
Europe, aggregated approximately 74%, 74% and 73% of consolidated net sales
for
the years ended March 31, 2007, 2006 and 2005, respectively. Sales to
customers in Europe represented 29%, 28% and 27% of consolidated net sales
for
the years ended March 31, 2007, 2006 and 2005, respectively. Sales to
customers in Asia represented 43%, 44% and 43% of consolidated net sales
for the
years ended March 31, 2007, 2006 and 2005, respectively. Sales into
China, including Hong Kong, represented 18%, 17% and 16% of consolidated
net
sales for the years ended March 31, 2007, 2006 and 2005,
respectively. Sales into Taiwan represented 10% of consolidated net
sales for the years ended March 31, 2007, 2006 and 2005. Sales into
any other individual foreign country did not exceed 10% of the Company’s net
sales for any of the years presented.
The
Company had two distributors who represented more than 10% of its net sales
during fiscal 2007, 2006 and 2005. The Company’s largest distributor
accounted for approximately 11% of its net sales and its second largest
distributor accounted for approximately 10% of net sales in fiscal
2007. The Company’s largest distributor accounted for approximately
13% of its net sales and its second largest distributor accounted for
approximately 11% of its net sales in fiscal 2006. The Company’s
largest distributor accounted for approximately 13% of its net sales and
its
second largest distributor accounted for approximately 12% of its net sales
in
fiscal 2005.
|
17.
|
FAIR
VALUE OF FINANCIAL
INSTRUMENTS
|
The
carrying amount of cash equivalents approximates fair value because their
maturity is less than three months. The carrying amount of short-term
and long-term investments approximates fair value as the securities are marked
to market as of each balance sheet date with any unrealized gains and losses
reported in stockholders’ equity. The carrying amount of accounts
receivable, accounts payable and accrued liabilities approximates fair value
due
to the short-term maturity of the amounts. The fair value of
short-term debt and lines of credit approximates their carrying value as
they
are estimated by discounting the future cash flows at rates currently offered
to
the Company for similar debt instruments.
The
Company has entered into certain financial instruments in the normal course
of
business to reduce its exposure to fluctuations in foreign exchange
rates. These financial instruments include standby letters of credit
and foreign currency forward contracts. When engaging in forward
contracts, risks arise from the possible inability of counterparties to meet
the
terms of their contracts and from movements in securities values, interest
rates
and foreign exchange rates. At March 31, 2007, there were no foreign
currency forward contracts outstanding. At March 31, 2006, the
Company held contracts with nominal amounts totaling $1.6 million, which
were entered into and hedged the Company’s foreign currency risk. The
value of the contracts is based on quoted market prices. The
contracts matured in April 2006. Unrealized gains and losses as of
the balance sheet dates and realized gains and losses for the years ending
March 31, 2007, 2006 and 2005 were immaterial.
|
18.
|
NET
INCOME PER COMMON
SHARE
|
The
following table sets forth the computation of basic and diluted net income
per
share (in thousands, except per share amounts):
|
Year
Ended March 31,
|
||||||||||||
|
2007
|
2006
|
2005
|
||||||||||
|
Net
income
|
$ |
357,029
|
$ |
242,369
|
$ |
213,785
|
||||||
|
Weighted
average common shares outstanding
|
215,498
|
210,104
|
206,740
|
|||||||||
|
Dilutive
effect of stock options
|
5,350
|
4,920
|
5,222
|
|||||||||
|
Weighted
average common and commonequivalent shares outstanding
|
220,848
|
215,024
|
211,962
|
|||||||||
|
Basic
net income per common share
|
$ |
1.66
|
$ |
1.15
|
$ |
1.03
|
||||||
|
Diluted
net income per common share
|
$ |
1.62
|
$ |
1.13
|
$ |
1.01
|
||||||
F-22
Weighted
average common shares exclude the effect of antidilutive options. As
of March 31, 2007, the number of options that were antidilutive were
36,103. As of March 31, 2006, there were no antidilutive options
outstanding. As of March 31, 2005, the number of options that were
antidilutive were 1,310,018.
|
19.
|
QUARTERLY
RESULTS (UNAUDITED)
|
The
following table presents the Company’s selected unaudited quarterly operating
results for eight quarters ended March 31, 2007. The Company believes
that all necessary adjustments have been made to present fairly the related
quarterly results (in thousands, except per share amounts):
|
First
Quarter
|
Second
Quarter
|
Third
Quarter
|
Fourth
Quarter
|
Total
|
||||||||||||||||
|
Fiscal
2007
|
||||||||||||||||||||
|
Net
sales
|
$ |
262,557
|
$ |
267,934
|
$ |
251,004
|
$ |
258,176
|
$ |
1,039,671
|
||||||||||
|
Gross
profit
|
158,484
|
161,961
|
149,710
|
154,601
|
624,756
|
|||||||||||||||
|
Operating
income
|
89,681
|
91,359
|
81,482
|
85,289
|
347,811
|
|||||||||||||||
|
Net
income
|
76,984
|
79,488
|
72,849
|
127,708
|
357,029
|
|||||||||||||||
|
Diluted
net income per common share
|
0.35
|
0.36
|
0.33
|
0.57
|
1.62
|
|||||||||||||||
|
First
Quarter
|
Second
Quarter
|
Third
Quarter
|
Fourth
Quarter
|
Total
|
||||||||||||||||
|
Fiscal
2006
|
||||||||||||||||||||
|
Net
sales
|
$ |
218,527
|
$ |
227,298
|
$ |
234,896
|
$ |
247,172
|
$ |
927,893
|
||||||||||
|
Gross
profit
|
127,505
|
134,556
|
140,270
|
148,546
|
550,877
|
|||||||||||||||
|
Operating
income
|
73,029
|
79,295
|
84,588
|
89,452
|
326,364
|
|||||||||||||||
|
Net
income
|
61,024
|
65,653
|
40,124
|
75,568
|
242,369
|
|||||||||||||||
|
Diluted
net income per common share
|
0.29
|
0.31
|
0.19
|
0.35
|
1.13
|
|||||||||||||||
Refer
to
Note 10, Income Taxes, for an explanation of the additional income tax expense
in the quarter ended December 31, 2005 related to the Company’s repatriation of
$500 million in foreign earnings under the Jobs Act and the $52.2 million
of tax benefit from a tax settlement in the quarter ended March 31,
2007.
|
20.
|
SUPPLEMENTAL
FINANCIAL INFORMATION
|
Cash
paid
for income taxes amounted to $72.6 million, $26.4 million and $15.6 million
during the years ended March 31, 2007, 2006 and 2005,
respectively. Cash paid for interest amounted to $5.4 million, $1.9
million and $0.8 million during the years ended March 31, 2007, 2006 and
2005,
respectively.
A
summary
of additions and deductions related to the allowance for doubtful accounts
for
the years ended March 31, 2007, 2006 and 2005 follows (amounts in
thousands):
|
Balance
at beginning of
year
|
Charged
to costs and expenses
|
Deductions
(1)
|
Balance
at end
of
year
|
|||||||||||||
|
Allowance
for doubtful accounts:
|
||||||||||||||||
|
2007
|
$ |
3,662
|
$ |
---
|
$ | (118 | ) | $ |
3,544
|
|||||||
|
2006
|
3,817
|
---
|
(155 | ) |
3,662
|
|||||||||||
|
2005
|
3,810
|
7
|
---
|
3,817
|
||||||||||||
|
|
(1)
Deductions represent uncollectible accounts written off, net of
recoveries.
|
F-23
21. DIVIDENDS
On
October 28, 2002, the Company announced that its Board of Directors had approved
and instituted a quarterly cash dividend on its common stock. The
initial quarterly dividend of $0.02 per share was paid on December 6, 2003
in
the amount of $4.1 million. The Company has continued to pay
quarterly dividends and has increased the amount of such dividends on a regular
basis. During the year ended March 31, 2007, the Company paid
dividends totaling $0.965 per share for a total dividend payment of $207.9
million. During the year ended March 31, 2006, the Company paid
dividends totaling $0.57 per share for a total dividend payment of $120.1
million. During the year ended March 31, 2005, the Company paid
dividends totaling $0.208 per share for a total dividend payout of $43.0
million.
F-24